Topological analysis of entropy measure using regression model for terpyridine complex nanosheet
Publication
Metrics
AI Quick Summary
This paper calculates topological indices, specifically the Nirmala index and its inverses, for terpyridine complex nanosheets and correlates these indices with entropy measures using a regression model, aiming to refine the structure for better applications. The study also includes graphical comparisons to aid in structural optimization.
Paper Preview
Abstract
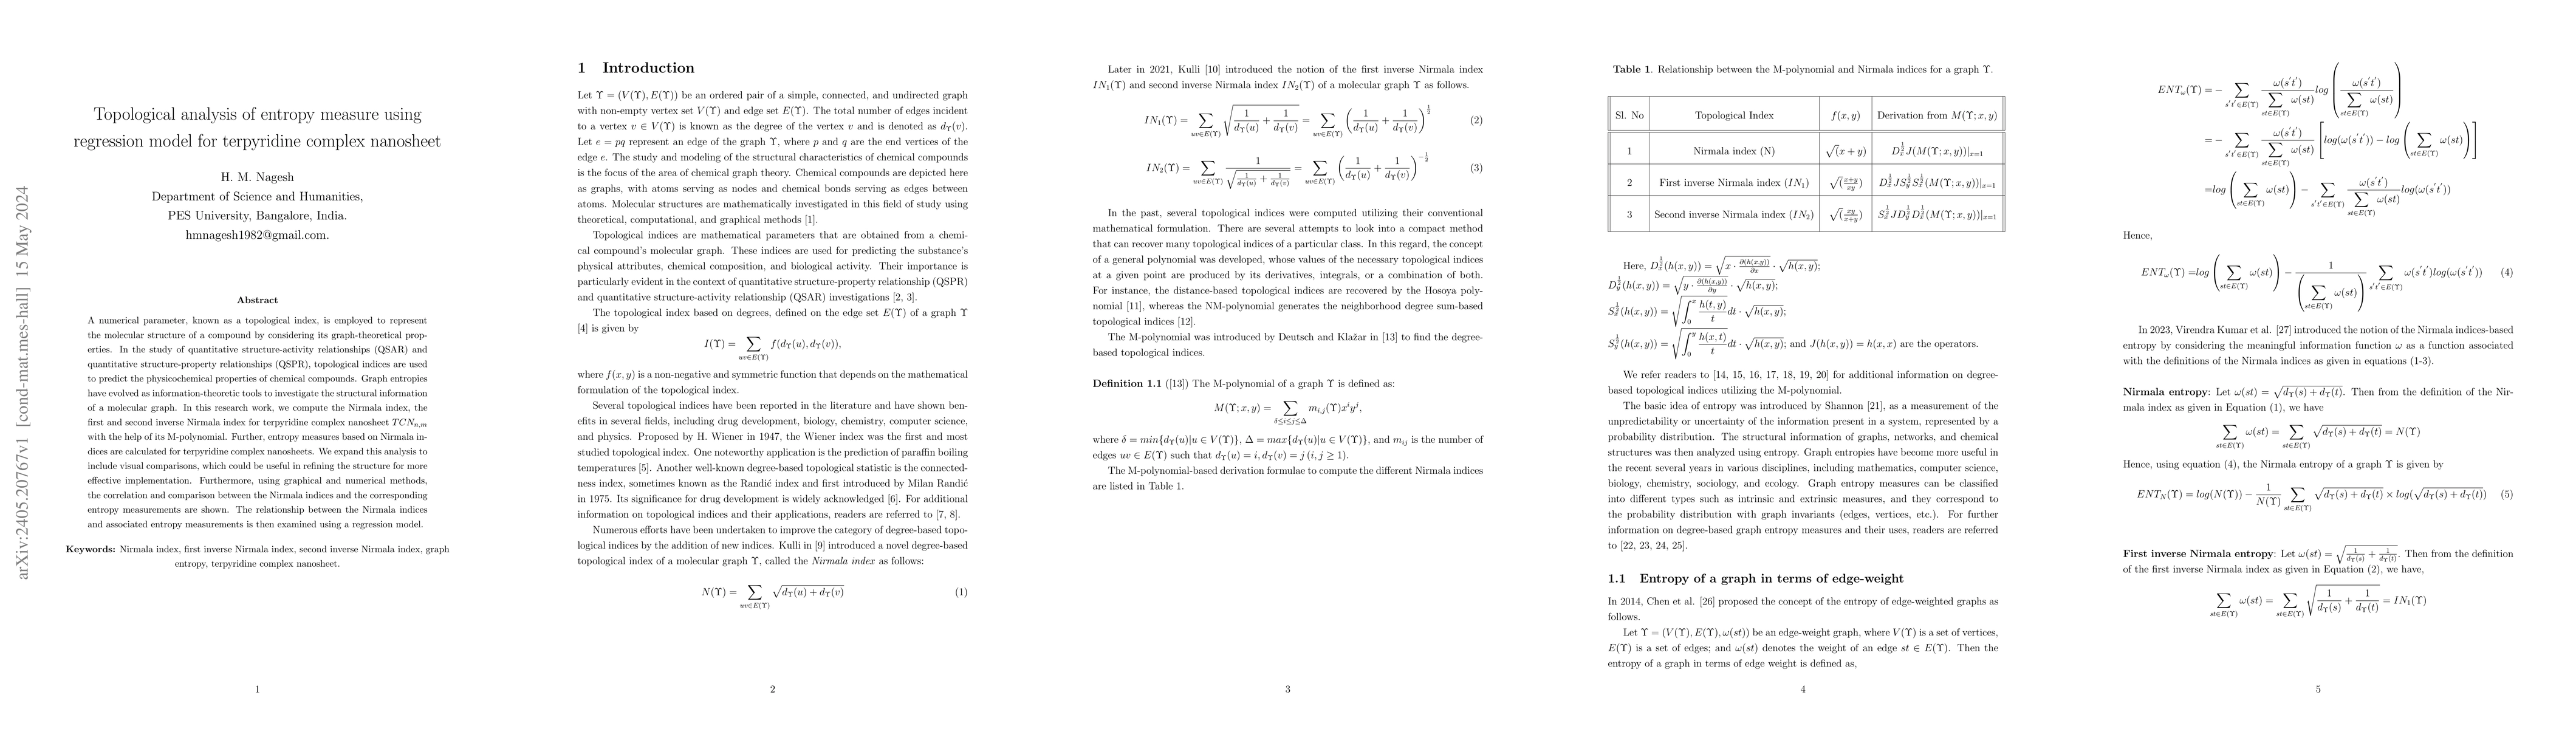
A numerical parameter, known as a topological index, is employed to represent the molecular structure of a compound by considering its graph-theoretical properties. In the study of quantitative structure-activity relationships (QSAR) and quantitative structure-property relationships (QSPR), topological indices are used to predict the physicochemical properties of chemical compounds. Graph entropies have evolved as information-theoretic tools to investigate the structural information of a molecular graph. In this research work, we compute the Nirmala index, the first and second inverse Nirmala index for terpyridine complex nanosheet $TCN_{n,m}$ with the help of its M-polynomial. Further, entropy measures based on Nirmala indices are calculated for terpyridine complex nanosheets. We expand this analysis to include visual comparisons, which could be useful in refining the structure for more effective implementation. Furthermore, using graphical and numerical methods, the correlation and comparison between the Nirmala indices and the corresponding entropy measurements are shown. The relationship between the Nirmala indices and associated entropy measurements is then examined using a regression model.
AI Key Findings
Get AI-generated insights about this paper's methodology, results, significance, and more — seven facets brought into focus.
Impact
Paper Details
Authors
PDF Preview
Key Terms
Citation Network
Current paper (gray), citations (green), references (blue)
Display is limited for performance on very large graphs.
Discussion 0