Publication
Metrics
AI Quick Summary
The paper reconstructs total solar irradiance (TSI) over the last five centuries, highlighting variations due to magnetic activity and sunspots, particularly during the Maunder minimum. It reveals a significant irradiance drop of about 2.5 W/m² during the Maunder minimum compared to present levels, with a subsequent increase of 1.5 W/m² in the first half of the last century that stabilized thereafter.
Paper Preview
Abstract
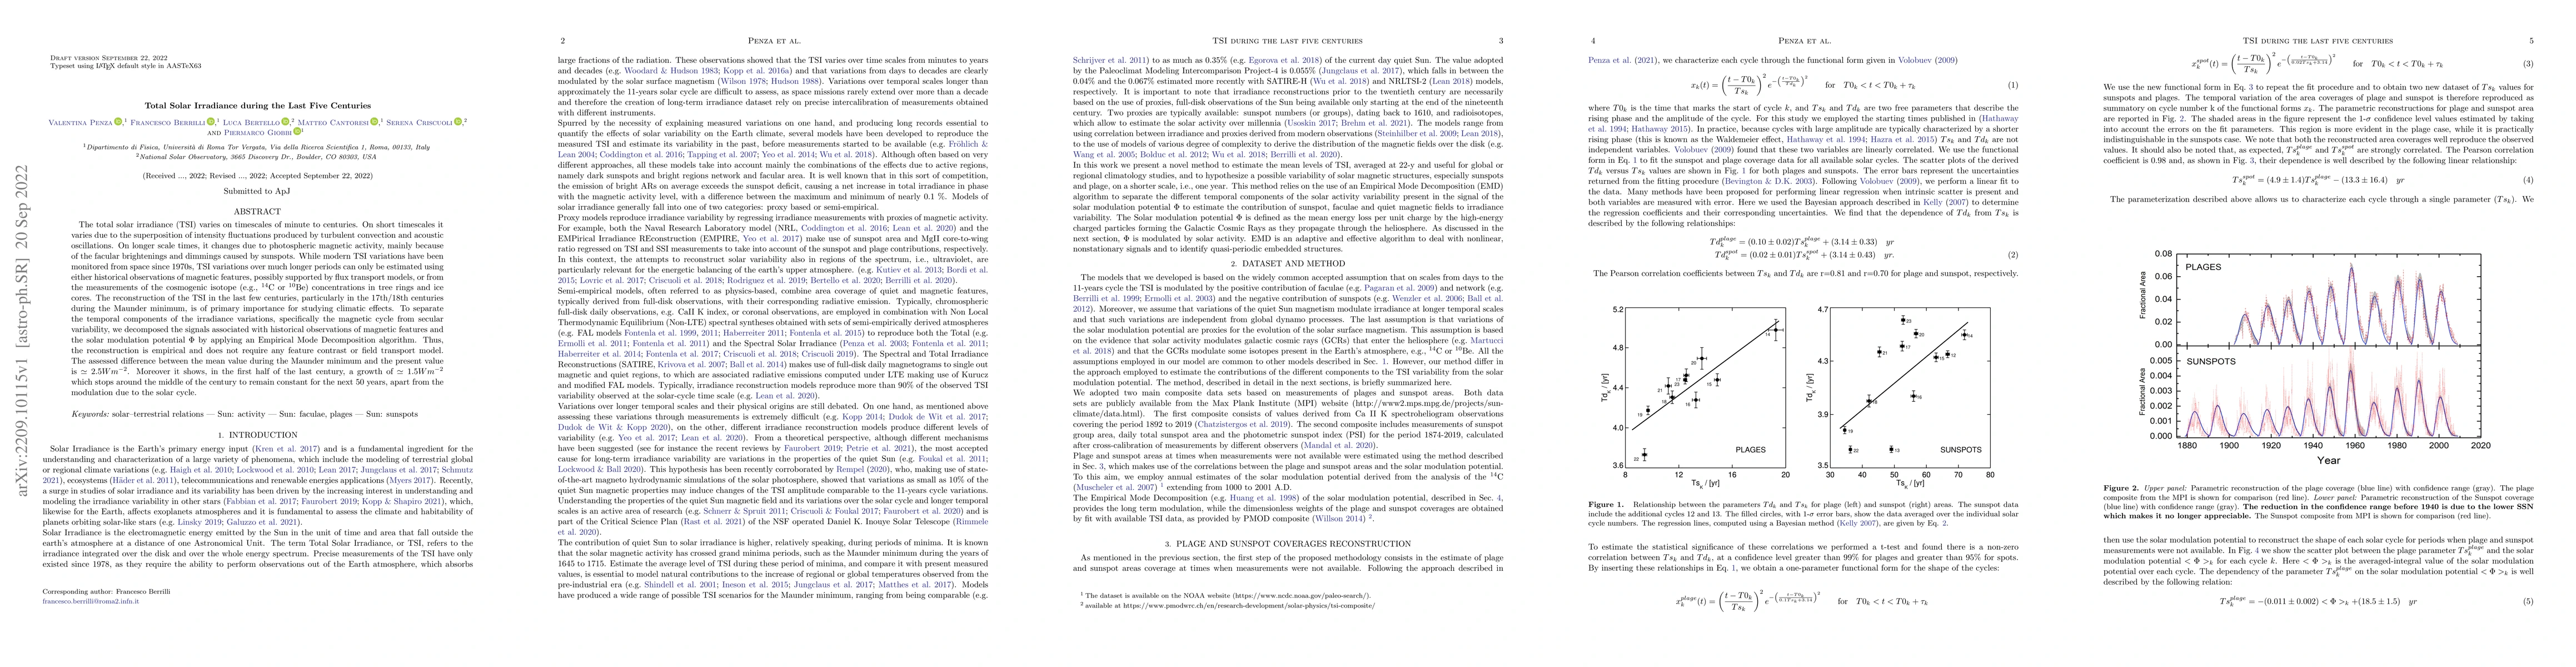
The total solar irradiance (TSI) varies on timescales of minute to centuries. On short timescales it varies due to the superposition of intensity fluctuations produced by turbulent convection and acoustic oscillations. On longer scale times, it changes due to photospheric magnetic activity, mainly because of the facular brightenings and dimmings caused by sunspots. While modern TSI variations have been monitored from space since 1970s, TSI variations over much longer periods can only be estimated using either historical observations of magnetic features, possibly supported by flux transport models, or from the measurements of the cosmogenic isotope (e.g., \textsuperscript{14}C or \textsuperscript{10}Be) concentrations in tree rings and ice cores. The reconstruction of the TSI in the last few centuries, particularly in the 17th/18th centuries during the Maunder minimum, is of primary importance for studying climatic effects. To separate the temporal components of the irradiance variations, specifically the magnetic cycle from secular variability, we decomposed the signals associated with historical observations of magnetic features and the solar modulation potential $\Phi$ by applying an Empirical Mode Decomposition algorithm. Thus, the reconstruction is empirical and does not require any feature contrast or field transport model. The assessed difference between the mean value during the Maunder minimum and the present value is $\simeq2.5 Wm^{-2}$. Moreover it shows, in the first half of the last century, a growth of $\simeq 1.5 W m^{-2}$ which stops around the middle of the century to remain constant for the next 50 years, apart from the modulation due to the solar cycle.
AI Key Findings
Get AI-generated insights about this paper's methodology, results, significance, and more — seven facets brought into focus.
Impact
Paper Details
Authors
PDF Preview
Citation Network
Current paper (gray), citations (green), references (blue)
Display is limited for performance on very large graphs.
Discussion 0