Touching and Feeling the Data: A Reusable Software Pipeline for Tactile Statistical Graphs in Accessible Education
Publication
Metrics
Paper Preview
Abstract
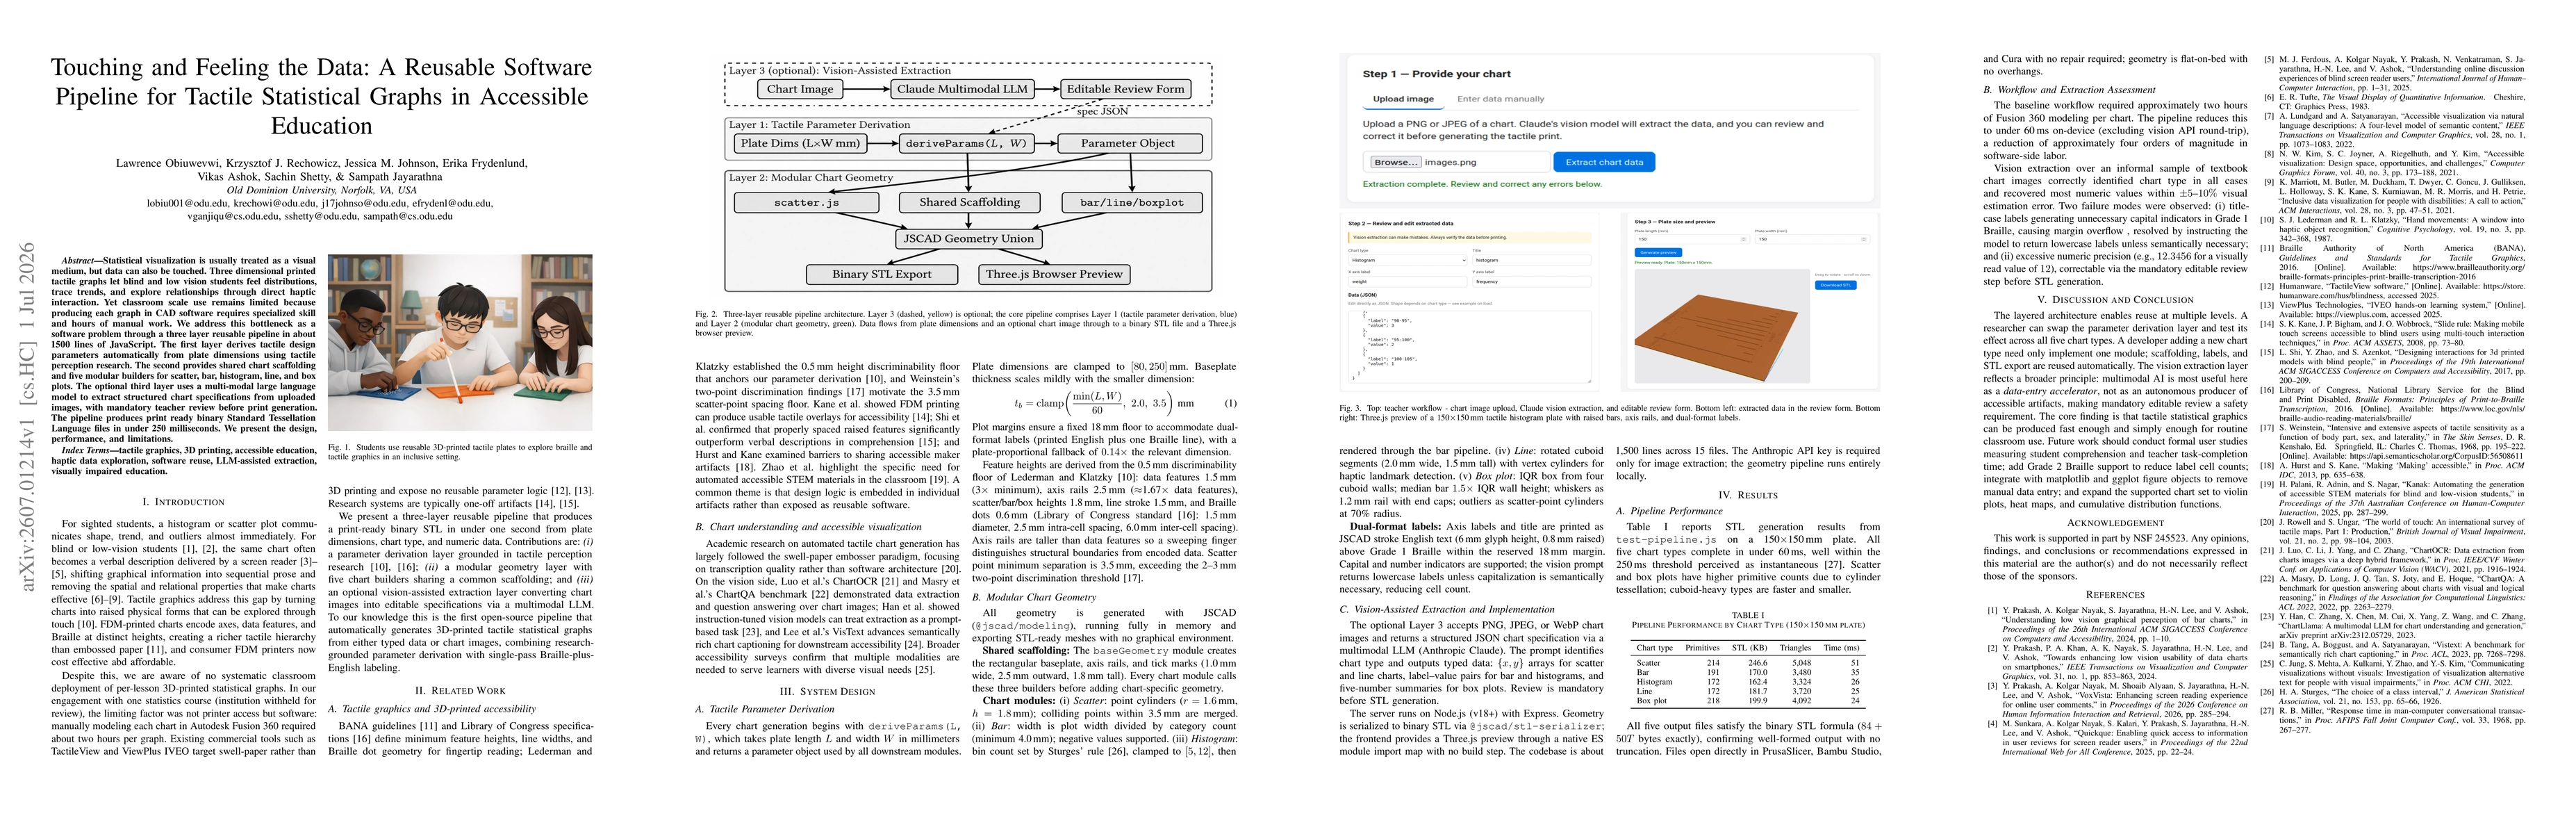
Statistical visualization is usually treated as a visual medium, but data can also be touched. Three dimensional printed tactile graphs let blind and low vision students feel distributions, trace trends, and explore relationships through direct haptic interaction. Yet classroom scale use remains limited because producing each graph in CAD software requires specialized skill and hours of manual work. We address this bottleneck as a software problem through a three layer reusable pipeline in about 1500 lines of JavaScript. The first layer derives tactile design parameters automatically from plate dimensions using tactile perception research. The second provides shared chart scaffolding and five modular builders for scatter, bar, histogram, line, and box plots. The optional third layer uses a multi-modal large language model to extract structured chart specifications from uploaded images, with mandatory teacher review before print generation. The pipeline produces print ready binary Standard Tessellation Language files in under 250 milliseconds. We present the design, performance, and limitations.
AI Key Findings
Get AI-generated insights about this paper's methodology, results, significance, and more — seven facets brought into focus.
Discussion 0