Toward A Deep Understanding of What Makes a Scientific Visualization Memorable
Publication
Metrics
Paper Preview
Abstract
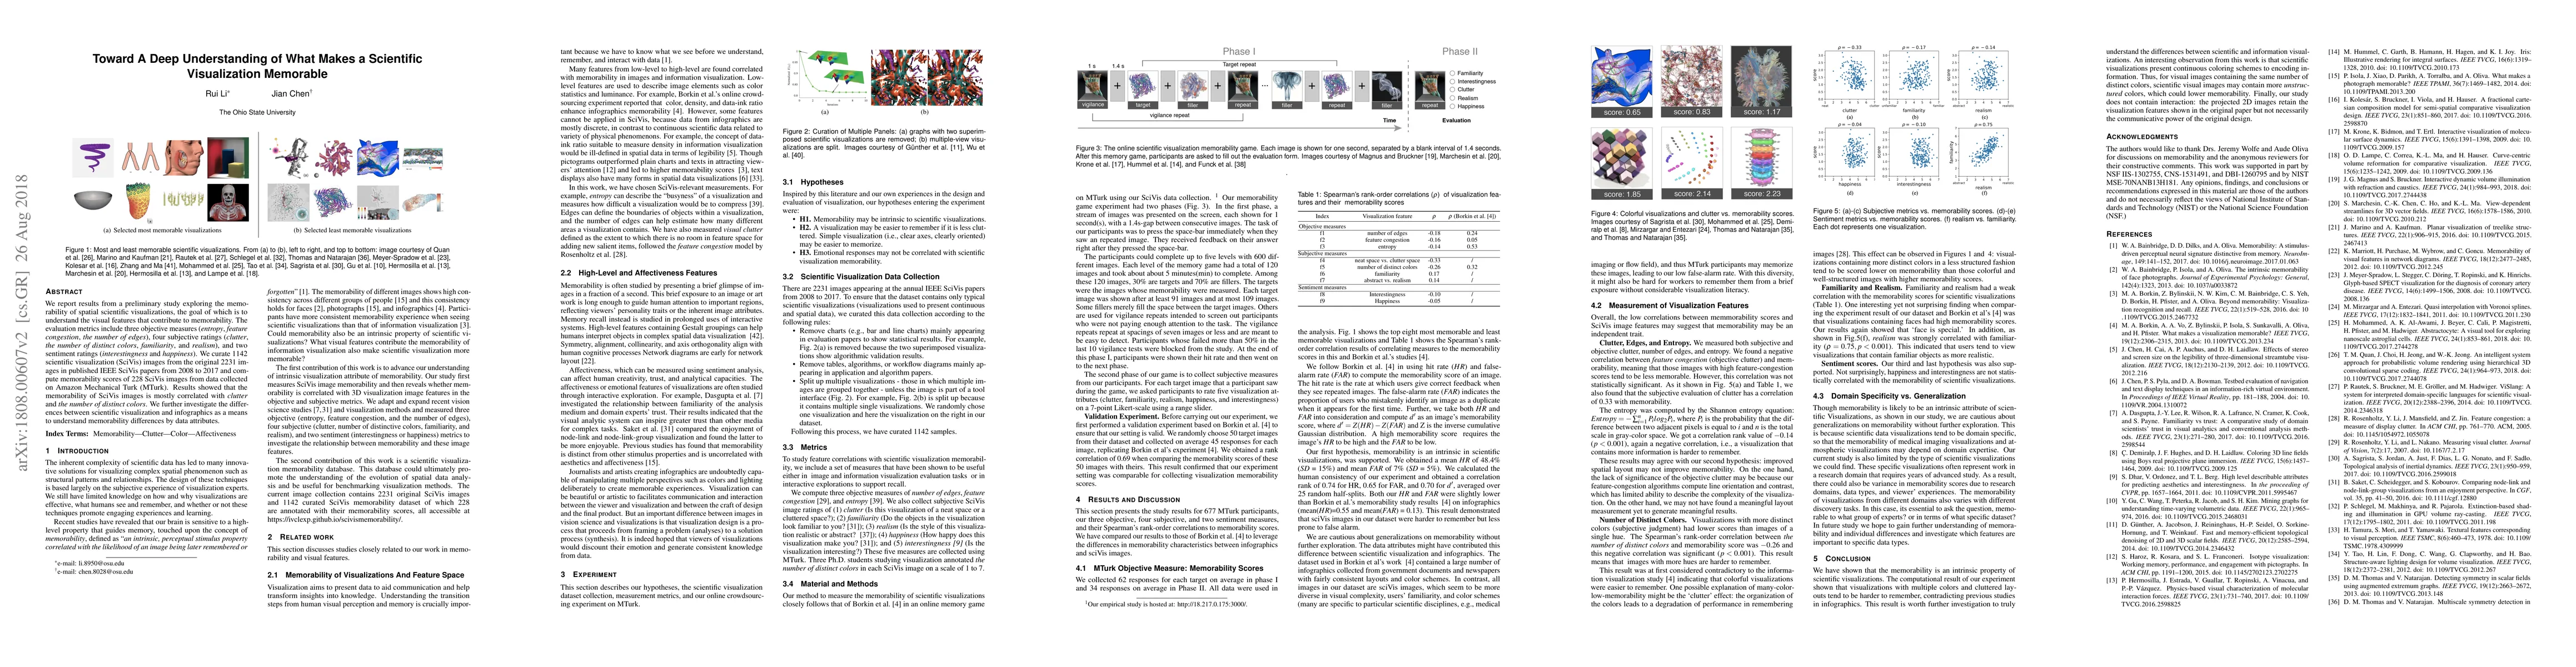
We report results from a preliminary study exploring the memorability of spatial scientific visualizations, the goal of which is to understand the visual features that contribute to memorability. The evaluation metrics include three objective measures (entropy, feature congestion, the number of edges), four subjective ratings (clutter, the number of distinct colors, familiarity, and realism), and two sentiment ratings (interestingness and happiness). We curate 1142 scientific visualization (SciVis) images from the original 2231 images in published IEEE SciVis papers from 2008 to 2017 and compute memorability scores of 228 SciVis images from data collected on Amazon Mechanical Turk (MTurk). Results showed that the memorability of SciVis images is mostly correlated with clutter and the number of distinct colors. We further investigate the differences between scientific visualization and infographics as a means to understand memorability differences by data attributes.
AI Key Findings
Get AI-generated insights about this paper's methodology, results, significance, and more — seven facets brought into focus.
Impact
Paper Details
PDF Preview
Key Terms
Citation Network
Current paper (gray), citations (green), references (blue)
Display is limited for performance on very large graphs.
Discussion 0