Toward Understanding Similarity of Visualization Techniques
Publication
Metrics
Paper Preview
Abstract
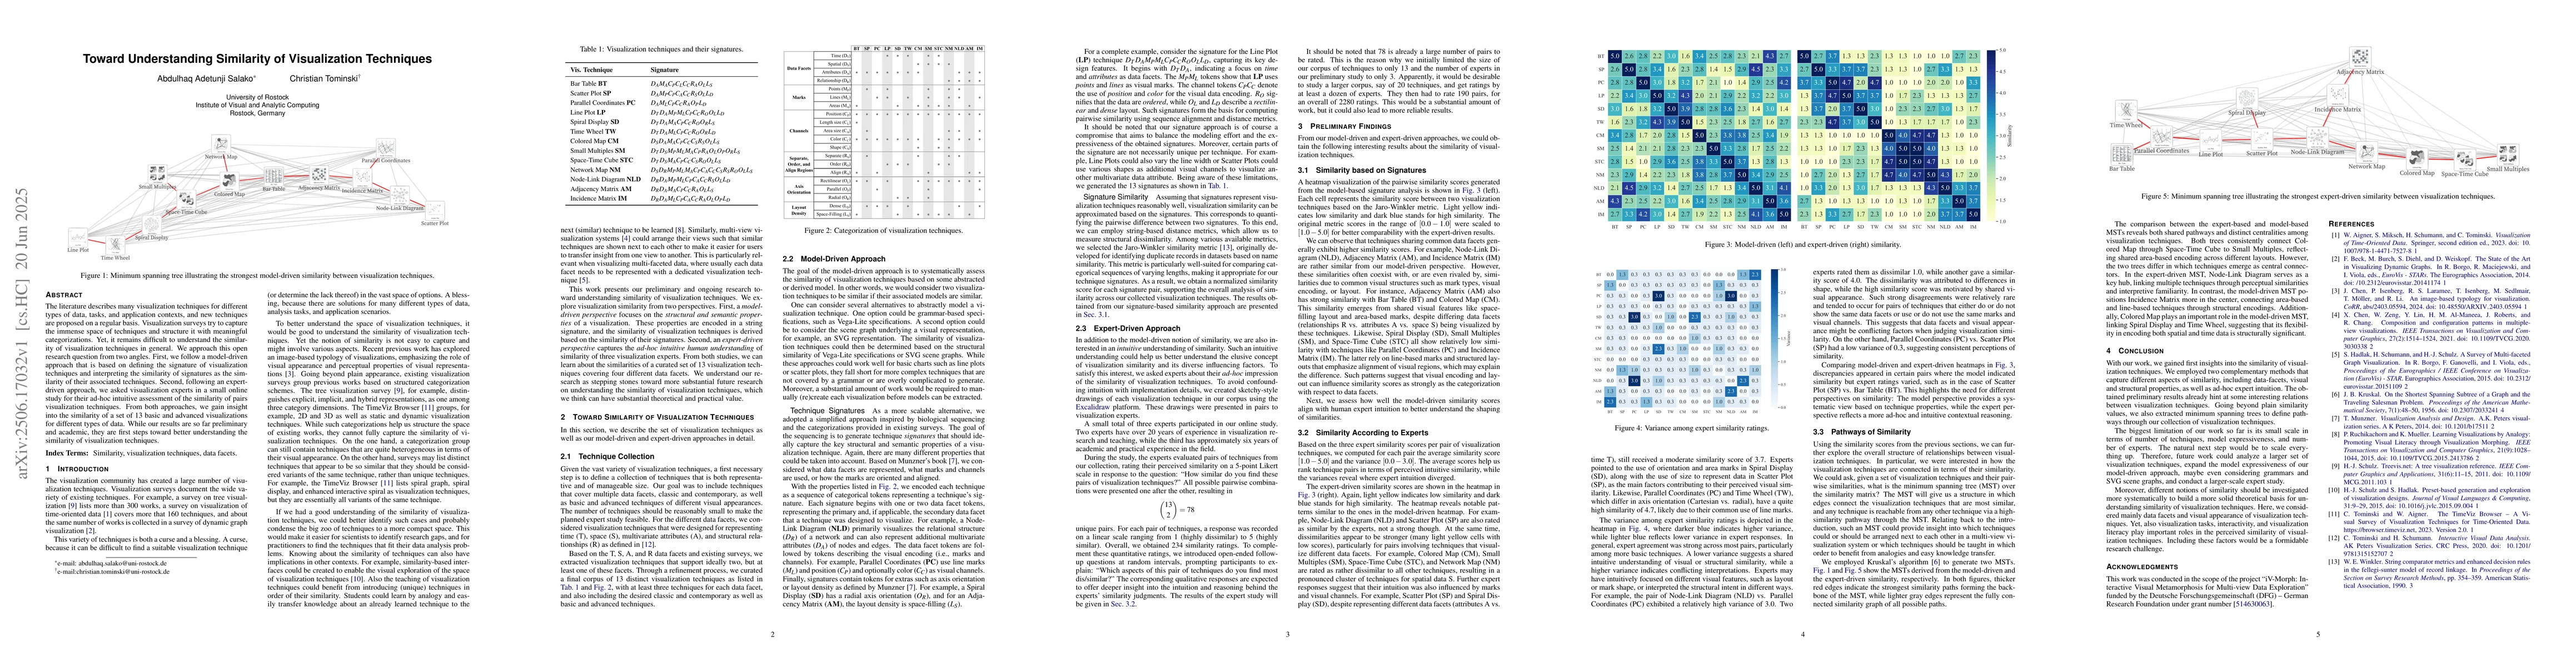
The literature describes many visualization techniques for different types of data, tasks, and application contexts, and new techniques are proposed on a regular basis. Visualization surveys try to capture the immense space of techniques and structure it with meaningful categorizations. Yet, it remains difficult to understand the similarity of visualization techniques in general. We approach this open research question from two angles. First, we follow a model-driven approach that is based on defining the signature of visualization techniques and interpreting the similarity of signatures as the similarity of their associated techniques. Second, following an expert-driven approach, we asked visualization experts in a small online study for their ad-hoc intuitive assessment of the similarity of pairs visualization techniques. From both approaches, we gain insight into the similarity of a set of 13 basic and advanced visualizations for different types of data. While our results are so far preliminary and academic, they are first steps toward better understanding the similarity of visualization techniques.
AI Key Findings
Get AI-generated insights about this paper's methodology, results, significance, and more — seven facets brought into focus.
Impact
Authors
PDF Preview
Citation Network
Current paper (gray), citations (green), references (blue)
Display is limited for performance on very large graphs.
Discussion 0