Summary
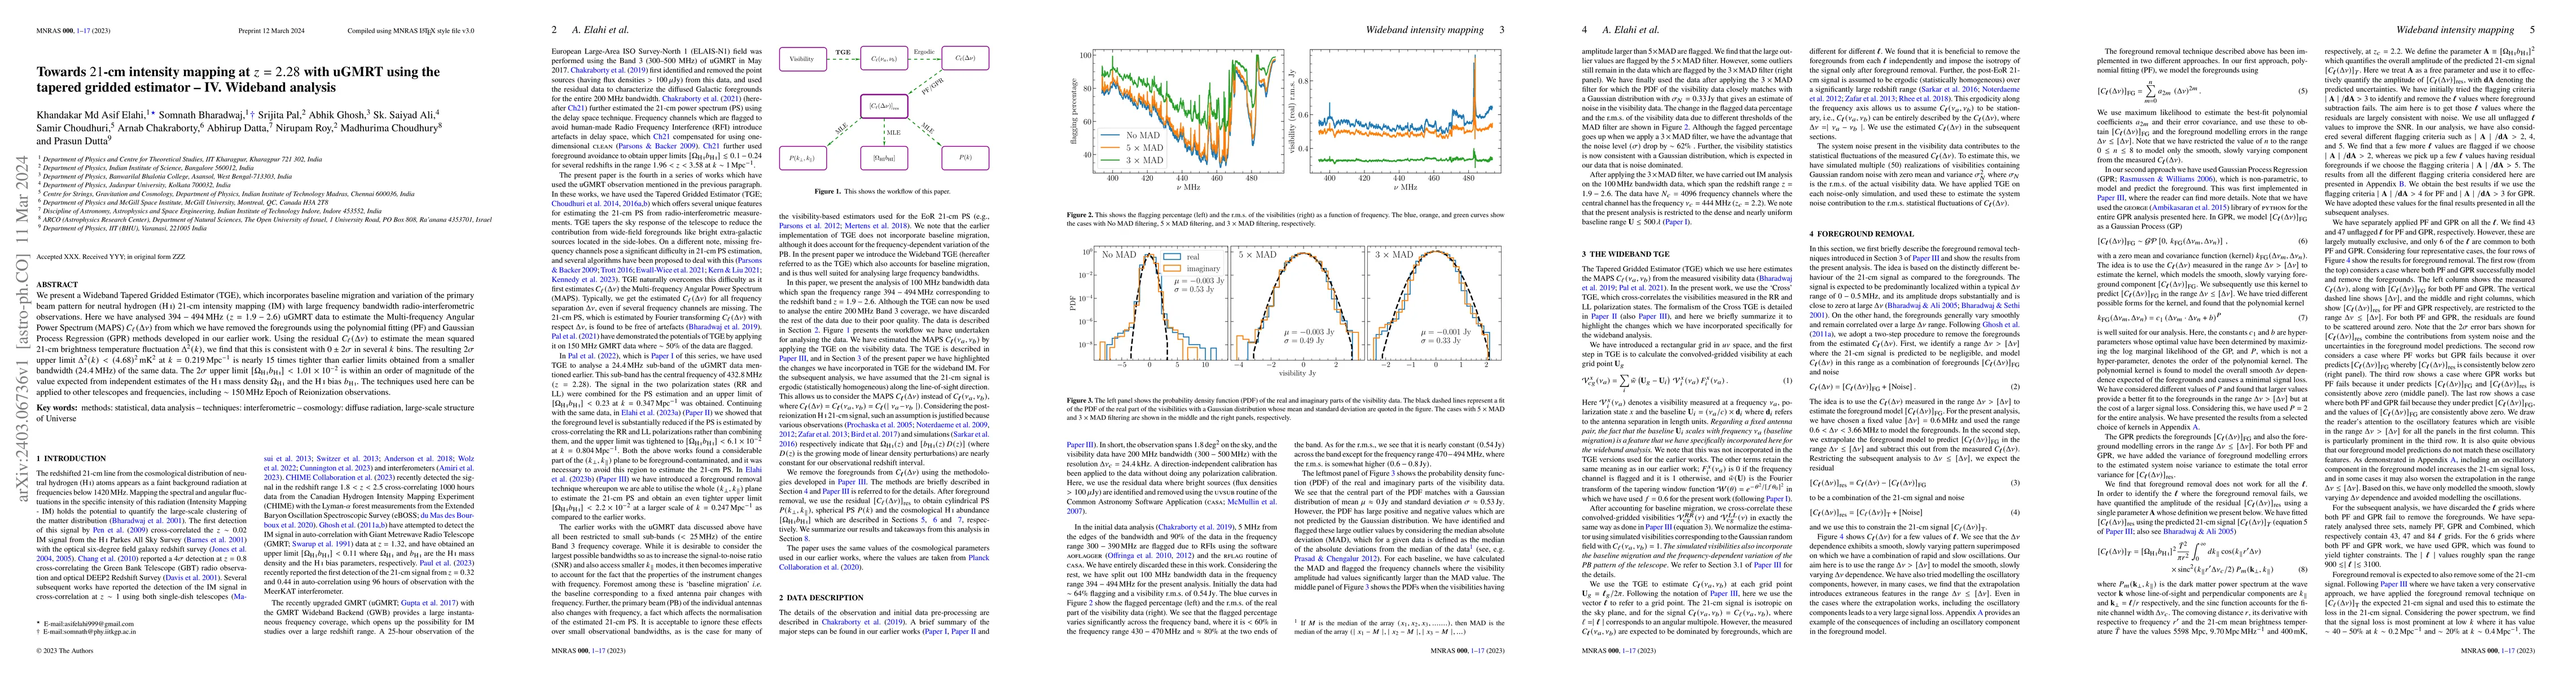
We present a Wideband Tapered Gridded Estimator (TGE), which incorporates baseline migration and variation of the primary beam pattern for neutral hydrogen (${\rm H\hspace{0.5mm}}{\scriptsize {\rm I}}$) 21-cm intensity mapping (IM) with large frequency bandwidth radio-interferometric observations. Here we have analysed $394-494 \, {\rm MHz}$ $(z = 1.9 - 2.6)$ uGMRT data to estimate the Multi-frequency Angular Power Spectrum (MAPS) $C_\ell(\Delta\nu)$ from which we have removed the foregrounds using the polynomial fitting (PF) and Gaussian Process Regression (GPR) methods developed in our earlier work. Using the residual $C_\ell(\Delta\nu)$ to estimate the mean squared 21-cm brightness temperature fluctuation $\Delta^2(k)$, we find that this is consistent with $0 \pm 2 \sigma$ in several $k$ bins. The resulting $2\sigma$ upper limit $\Delta^2(k) < (4.68)^2 \, \rm{mK^2}$ at $k=0.219\,\rm{Mpc^{-1}}$ is nearly $15$ times tighter than earlier limits obtained from a smaller bandwidth ($24.4 \, {\rm MHz}$) of the same data. The $2\sigma$ upper limit $[\Omega_{{\rm H\hspace{0.5mm}}{\scriptsize {\rm I}}} b_{{\rm H\hspace{0.5mm}}{\scriptsize {\rm I}}}] < 1.01 \times 10^{-2}$ is within an order of magnitude of the value expected from independent estimates of the ${\rm H\hspace{0.5mm}}{\scriptsize {\rm I}}$ mass density $\Omega_{{\rm H\hspace{0.5mm}}{\scriptsize {\rm I}}}$ and the ${\rm H\hspace{0.5mm}}{\scriptsize {\rm I}}$ bias $b_{{\rm H\hspace{0.5mm}}{\scriptsize {\rm I}}}$. The techniques used here can be applied to other telescopes and frequencies, including $\sim 150 \, {\rm MHz}$ Epoch of Reionization observations.
AI Key Findings
Get AI-generated insights about this paper's methodology, results, and significance.
Paper Details
PDF Preview
Key Terms
Citation Network
Current paper (gray), citations (green), references (blue)
Display is limited for performance on very large graphs.
Similar Papers
Found 4 papersTowards 21-cm Intensity Mapping at $z=2.28$ with uGMRT using the Tapered Gridded Estimator I: Foreground Avoidance
Abhirup Datta, Arnab Chakraborty, Nirupam Roy et al.
Towards $21$-cm intensity mapping at $z=2.28$ with uGMRT using the tapered gridded estimator III: Foreground removal
Abhirup Datta, Arnab Chakraborty, Nirupam Roy et al.
Towards $21$-cm intensity mapping at $z=2.28$ with uGMRT using the tapered gridded estimator II: Cross-polarization power spectrum
Abhirup Datta, Arnab Chakraborty, Nirupam Roy et al.
| Title | Authors | Year | Actions |
|---|
Comments (0)