Towards a Survey of Visualization Methods for Power Grids
Publication
Metrics
AI Quick Summary
This paper reviews visualization methods for power grids to improve network analysis, maintenance, and planning, highlighting their advantages and disadvantages. It aims to provide a comprehensive overview of the field and identify open research questions for further improvement.
Paper Preview
Abstract
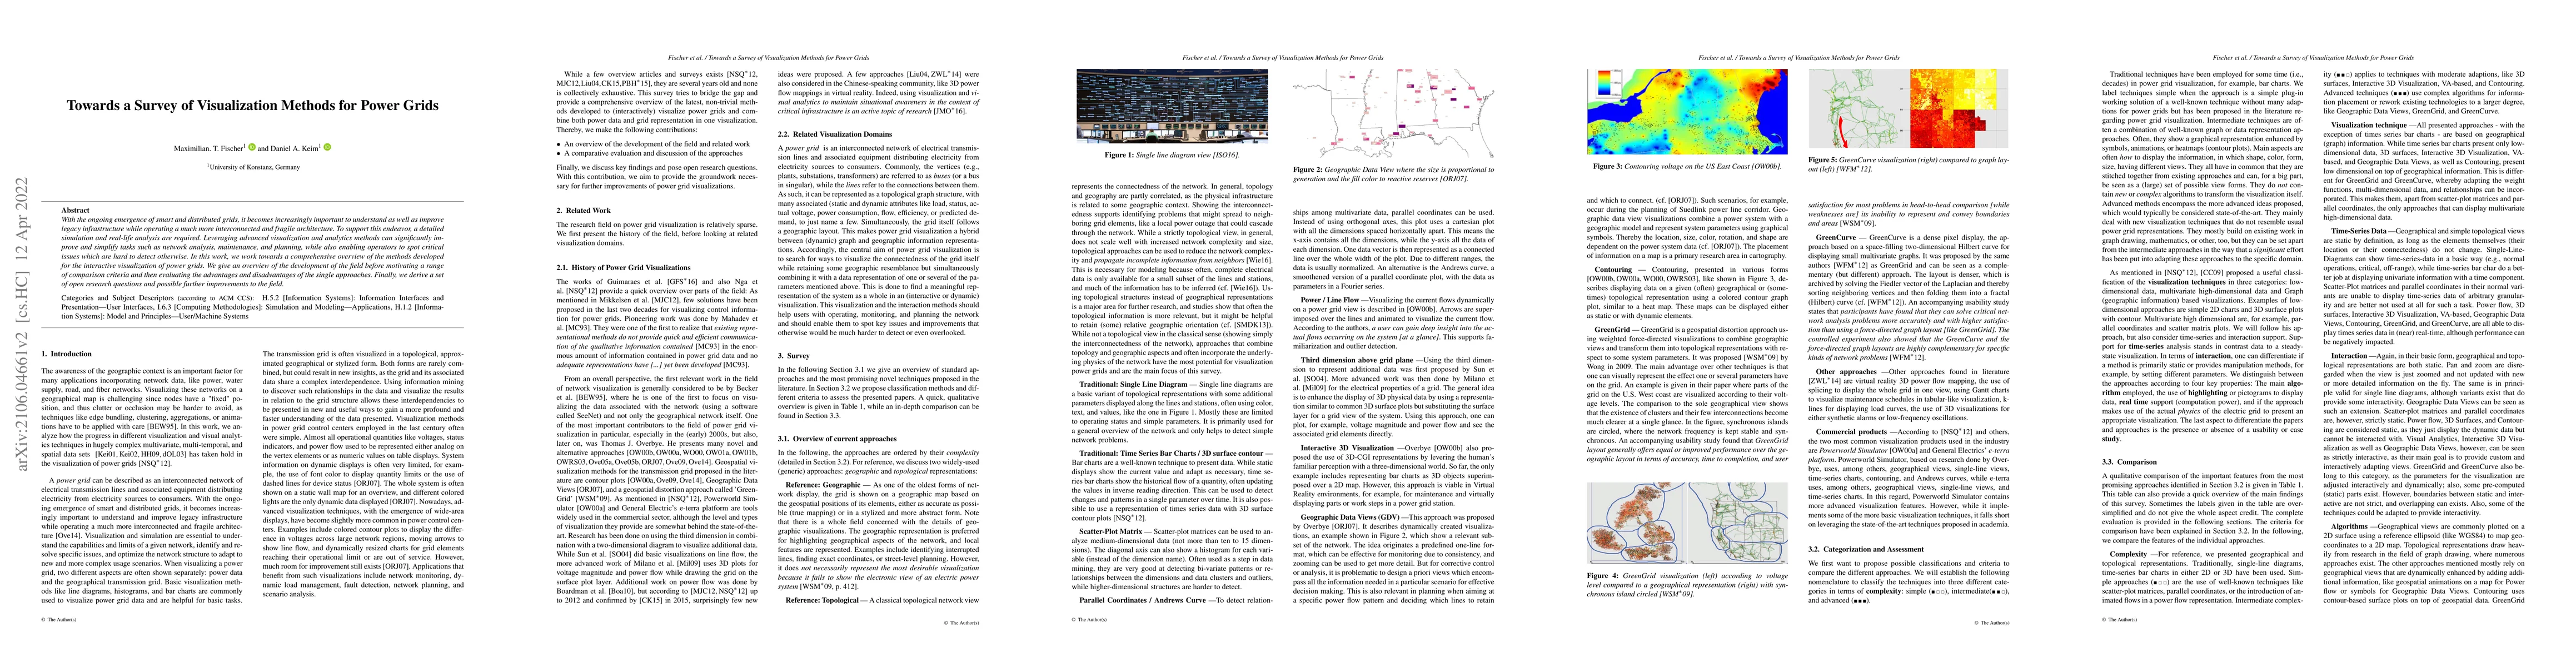
With the ongoing emergence of smart and distributed grids, it becomes increasingly important to understand as well as improve legacy infrastructure while operating a much more interconnected and fragile architecture. To support this endeavor, a detailed simulation and real-life analysis are required. Leveraging advanced visualization and analytics methods can significantly improve and simplify tasks such as network analysis, maintenance, and planning, while also enabling operators to spot critical issues which are hard to detect otherwise. In this work, we work towards a comprehensive overview of the methods developed for the interactive visualization of power grids. We give an overview of the development of the field before motivating a range of comparison criteria and then evaluating the advantages and disadvantages of the single approaches. Finally, we derive a set of open research questions and possible further improvements to the field.
AI Key Findings
Get AI-generated insights about this paper's methodology, results, significance, and more — seven facets brought into focus.
Impact
Paper Details
Authors
PDF Preview
Key Terms
Citation Network
Current paper (gray), citations (green), references (blue)
Display is limited for performance on very large graphs.
Discussion 0