Towards a Unified User Interface for Visual Analysis of Retinal Data in Ophthalmology
Publication
Metrics
AI Quick Summary
This paper proposes a unified user interface toolchain for visualizing retinal data to streamline ophthalmologists' workflows, combining necessary tools, data handling, and view organization. Initial feedback from experts indicates potential improvements in efficiency and ease of use in ophthalmic research.
Paper Preview
Abstract
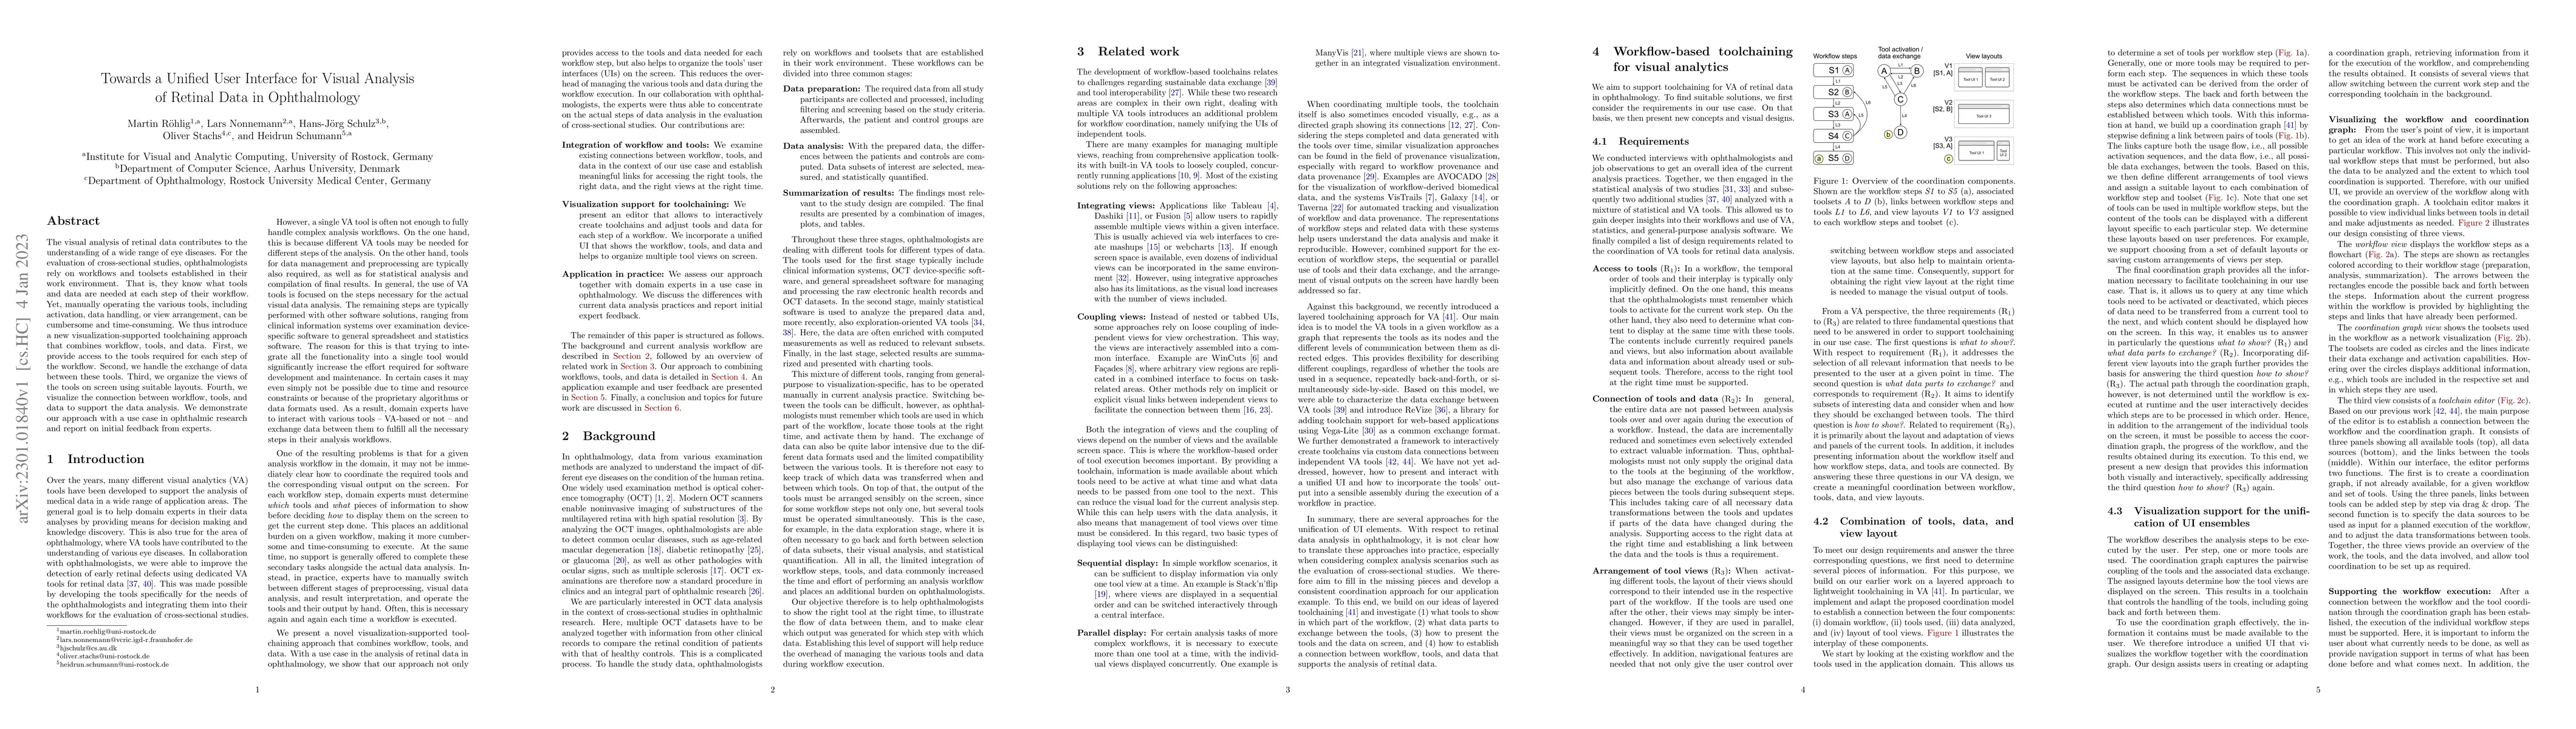
The visual analysis of retinal data contributes to the understanding of a wide range of eye diseases. For the evaluation of cross-sectional studies, ophthalmologists rely on workflows and toolsets established in their work environment. That is, they know what tools and data are needed at each step of their workflow. Yet, manually operating the various tools, including activation, data handling, or view arrangement, can be cumbersome and time-consuming. We thus introduce a new visualization-supported toolchaining approach that combines workflow, tools, and data. First, we provide access to the tools required for each step of the workflow. Second, we handle the exchange of data between these tools. Third, we organize the views of the tools on screen using suitable layouts. Fourth, we visualize the connection between workflow, tools, and data to support the data analysis. We demonstrate our approach with a use case in ophthalmic research and report on initial feedback from experts.
AI Key Findings
Get AI-generated insights about this paper's methodology, results, significance, and more — seven facets brought into focus.
Impact
Paper Details
Authors
PDF Preview
Key Terms
Citation Network
Current paper (gray), citations (green), references (blue)
Display is limited for performance on very large graphs.
Discussion 0