Towards Efficient Visual Simplification of Computational Graphs in Deep Neural Networks
Publication
Metrics
AI Quick Summary
This paper proposes visual simplification techniques for large, complex computational graphs in deep neural networks, including cycle-removing, edge-pruning, and subgraph stacking methods. The developed interactive visualization system, integrated into the open-source toolkit MindInsight, reduces graph elements by 60% on average, improving DNN model recognition and diagnosis.
Paper Preview
Abstract
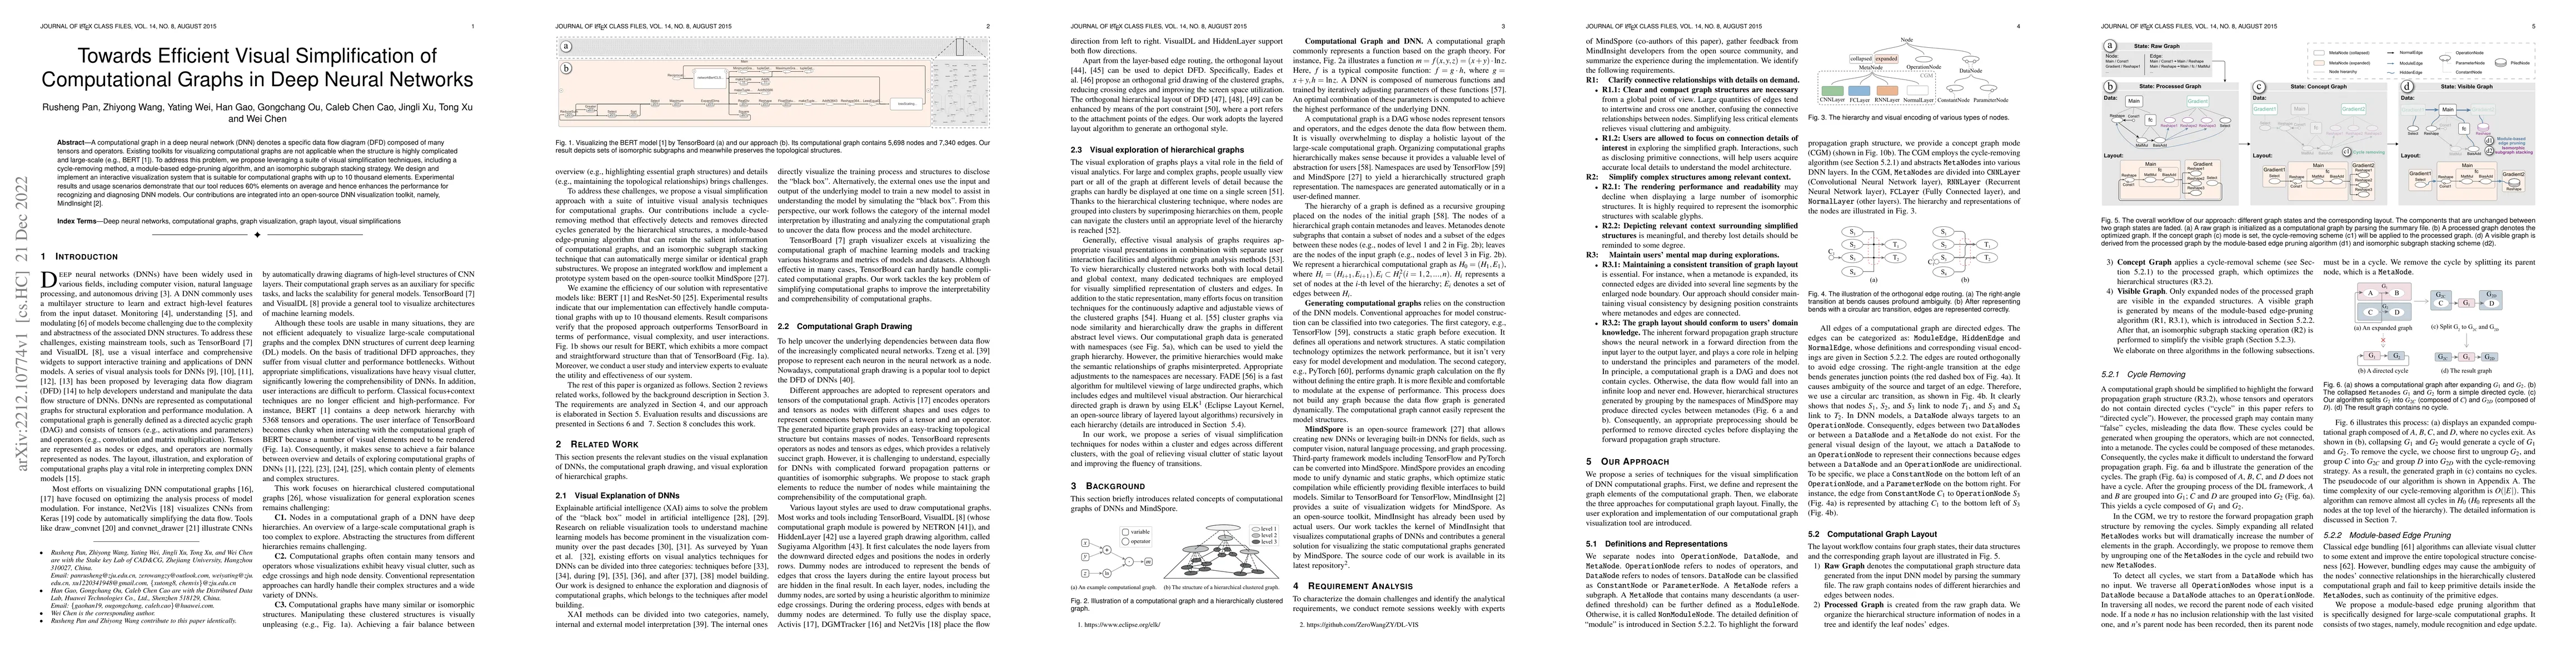
A computational graph in a deep neural network (DNN) denotes a specific data flow diagram (DFD) composed of many tensors and operators. Existing toolkits for visualizing computational graphs are not applicable when the structure is highly complicated and large-scale (e.g., BERT [1]). To address this problem, we propose leveraging a suite of visual simplification techniques, including a cycle-removing method, a module-based edge-pruning algorithm, and an isomorphic subgraph stacking strategy. We design and implement an interactive visualization system that is suitable for computational graphs with up to 10 thousand elements. Experimental results and usage scenarios demonstrate that our tool reduces 60% elements on average and hence enhances the performance for recognizing and diagnosing DNN models. Our contributions are integrated into an open-source DNN visualization toolkit, namely, MindInsight [2].
AI Key Findings
Get AI-generated insights about this paper's methodology, results, significance, and more — seven facets brought into focus.
Impact
Paper Details
Authors
PDF Preview
Key Terms
Citation Network
Current paper (gray), citations (green), references (blue)
Display is limited for performance on very large graphs.
Discussion 0