Publication
Metrics
AI Quick Summary
This paper proposes a method to explain distribution shifts using interpretable transportation maps derived from optimal transport, aiming to aid in manual mitigation tasks. The study demonstrates the effectiveness of these mappings across various real-world datasets, showing improved interpretability compared to baseline methods.
Paper Preview
Abstract
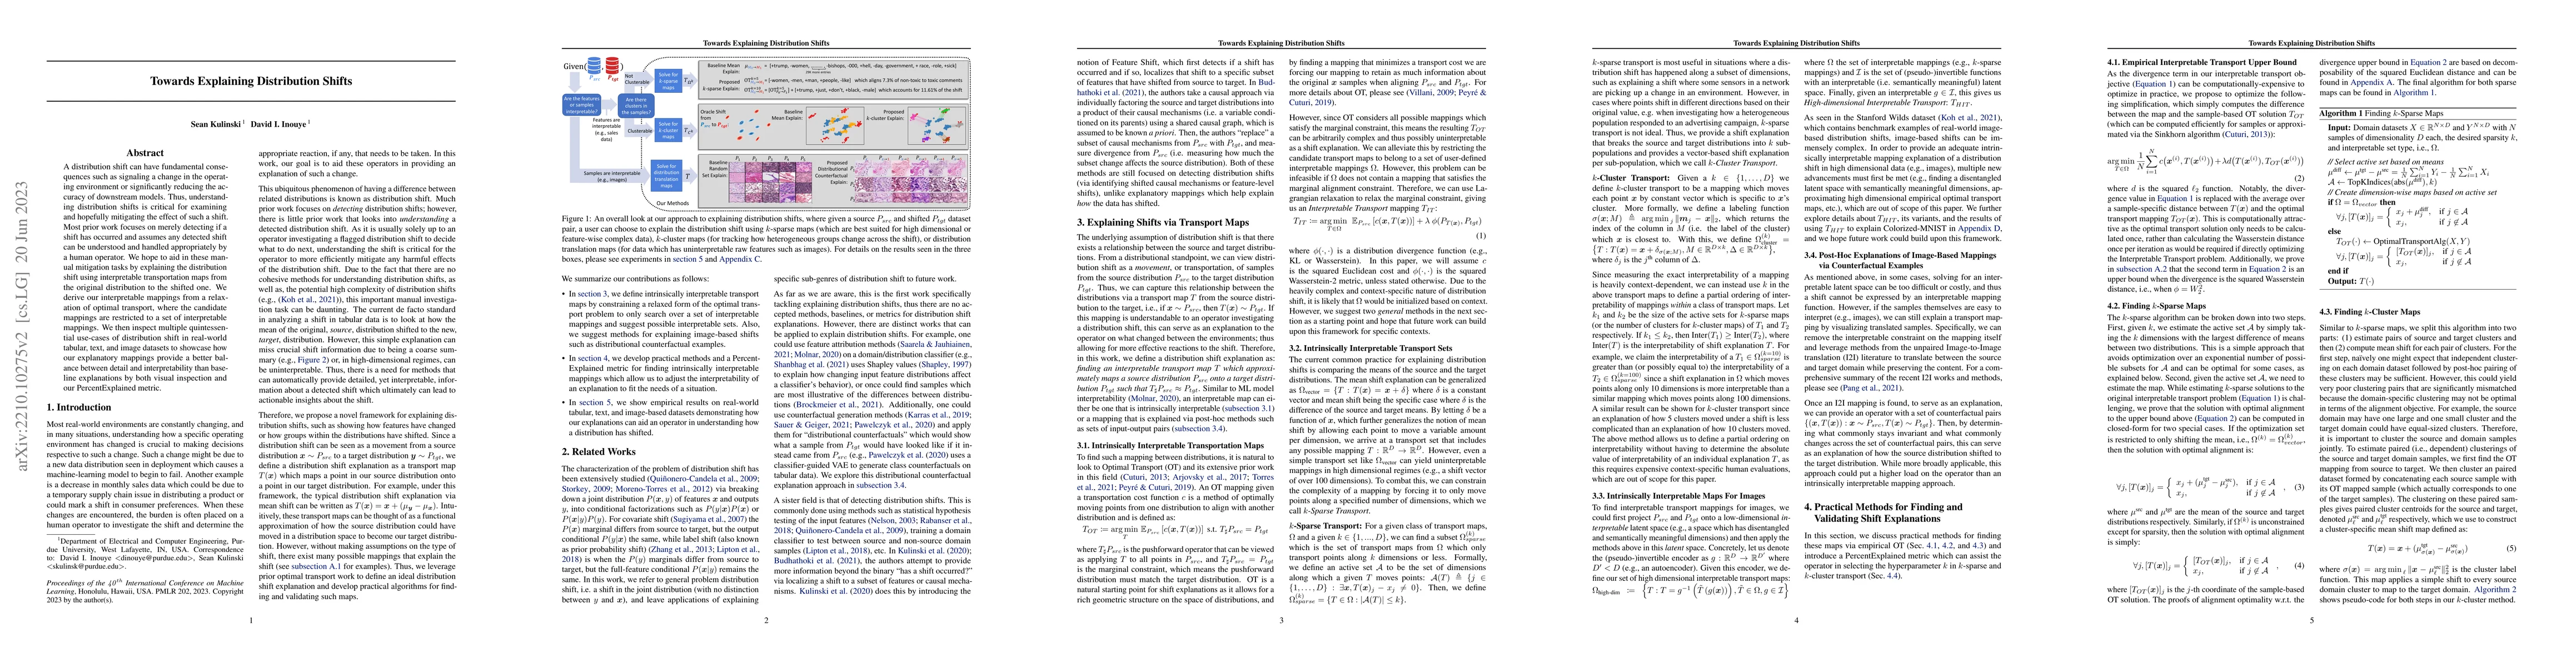
A distribution shift can have fundamental consequences such as signaling a change in the operating environment or significantly reducing the accuracy of downstream models. Thus, understanding distribution shifts is critical for examining and hopefully mitigating the effect of such a shift. Most prior work focuses on merely detecting if a shift has occurred and assumes any detected shift can be understood and handled appropriately by a human operator. We hope to aid in these manual mitigation tasks by explaining the distribution shift using interpretable transportation maps from the original distribution to the shifted one. We derive our interpretable mappings from a relaxation of optimal transport, where the candidate mappings are restricted to a set of interpretable mappings. We then inspect multiple quintessential use-cases of distribution shift in real-world tabular, text, and image datasets to showcase how our explanatory mappings provide a better balance between detail and interpretability than baseline explanations by both visual inspection and our PercentExplained metric.
AI Key Findings
Get AI-generated insights about this paper's methodology, results, significance, and more — seven facets brought into focus.
Impact
Paper Details
Authors
PDF Preview
Key Terms
Citation Network
Current paper (gray), citations (green), references (blue)
Display is limited for performance on very large graphs.
Discussion 0