Towards improved software visualisation of parameterised REE patterns: Introducing REEkit for geological analysis
Publication
Metrics
AI Quick Summary
This study introduces 'REEkit' for visualising rare earth element patterns in geological samples, focusing on lambda techniques to facilitate data interpretation. The evaluation found that familiar and clear visualisations, like 3D scatter plots and scatter plot matrices, were most effective for mineral exploration, highlighting the importance of complementary and integrated visualisations for comprehensive data analysis.
Paper Preview
Abstract
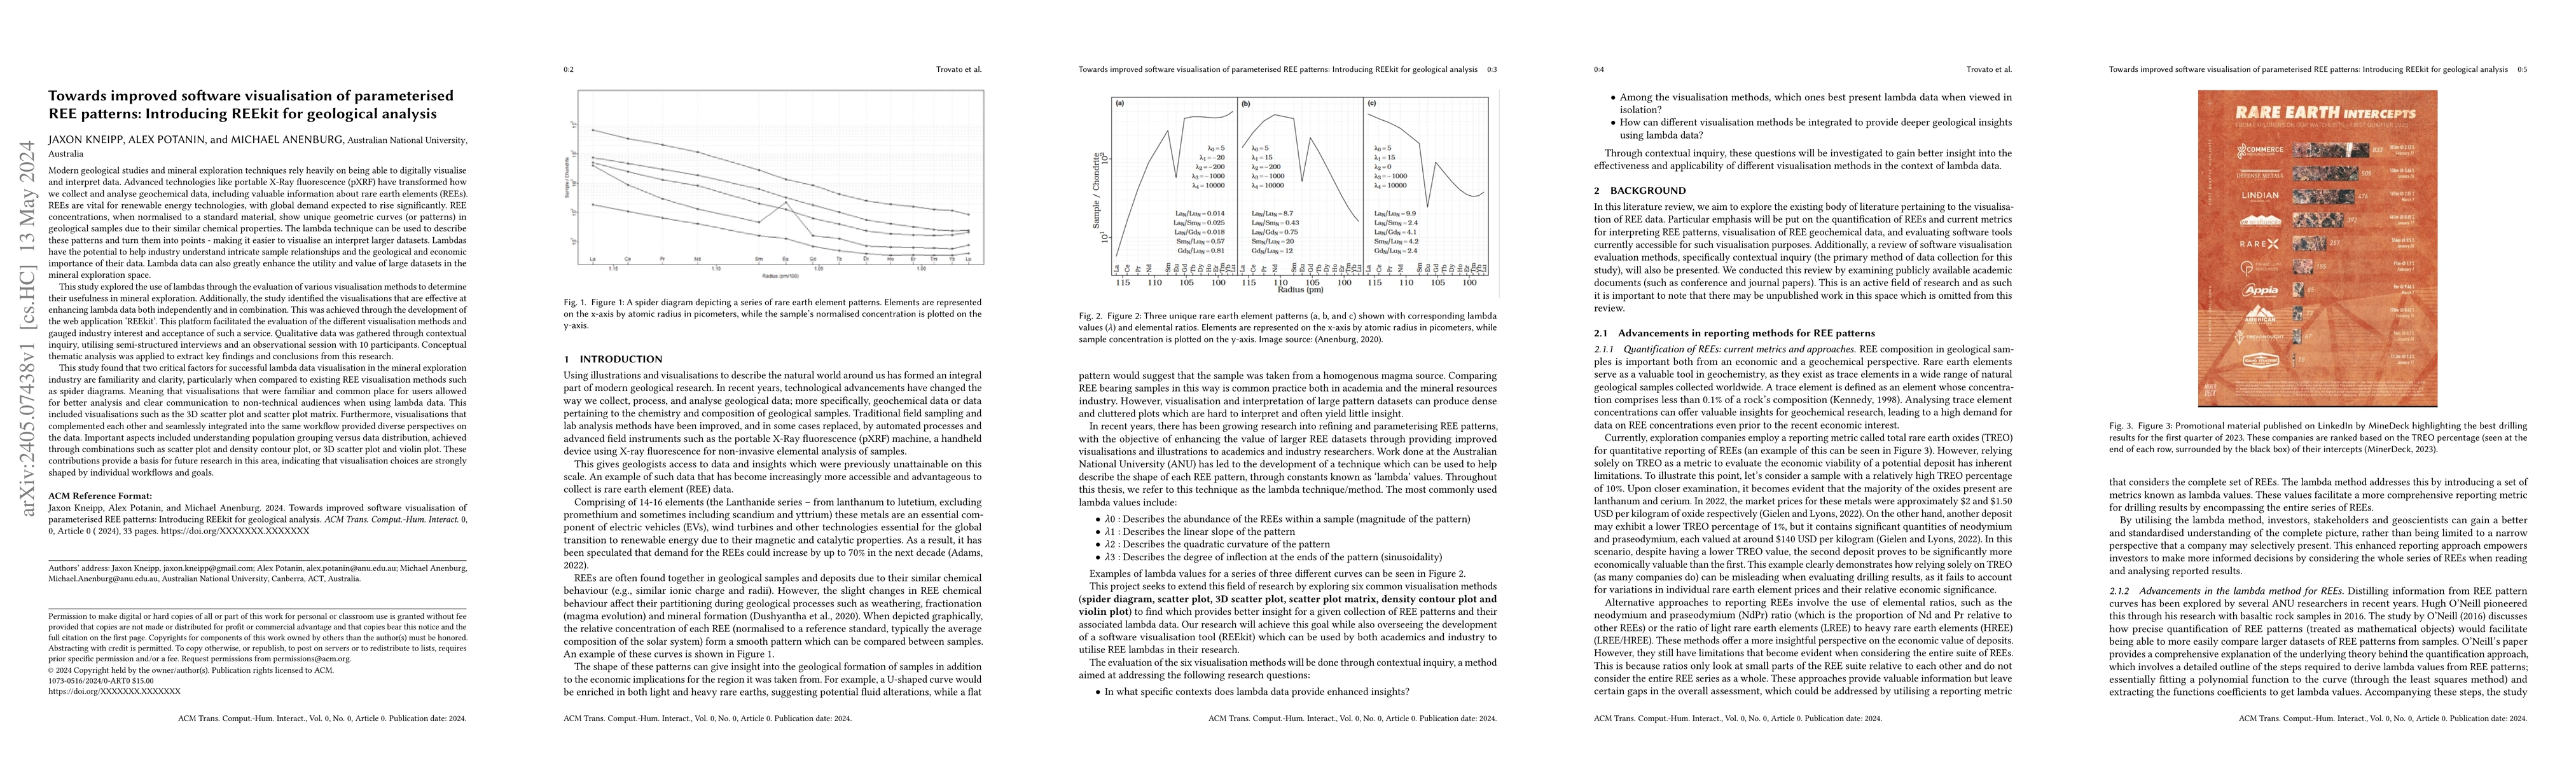
Modern geological studies and mineral exploration techniques rely heavily on being able to digitally visualise and interpret data. Rare earth elements (REEs) are vital for renewable energy technologies. REE concentrations, when normalised to a standard material, show unique geometric curves (or patterns) in geological samples due to their similar chemical properties. The lambda technique can be used to describe these patterns and turn them into points - making it easier to visualise and interpret larger datasets. Lambdas have the potential to help industry understand intricate sample relationships and the geological and economic importance of their data. This study explored the use of lambdas through the evaluation of various visualisation methods to determine their usefulness in mineral exploration. The 'REEkit' platform facilitated the evaluation of the different visualisation methods and gauged industry interest and acceptance of such a service. Qualitative data was gathered through contextual inquiry, utilising semi-structured interviews and an observational session with 10 participants. Conceptual thematic analysis was applied to extract key findings. This study found that two critical factors for successful lambda data visualisation in the mineral exploration industry are familiarity and clarity: visualisations that were familiar and commonplace for users allowed for better analysis and clear communication to non-technical audiences. This included visualisations such as the 3D scatter plot and scatter plot matrix. Furthermore, visualisations that complemented each other and seamlessly integrated into the same workflow provided diverse perspectives on the data. Important aspects included understanding population grouping versus data distribution, achieved through combinations such as scatter plot and density contour plot, or 3D scatter plot and violin plot.
AI Key Findings
Get AI-generated insights about this paper's methodology, results, significance, and more — seven facets brought into focus.
Paper Details
Authors
PDF Preview
Key Terms
Related Papers
No references found for this paper.
Discussion 0