To continuously monitor mobility flows aboard public transportation, low-cost
data collection methods based on the passive detection of Wi-Fi signals are
promising technological solutions, but they yield uncertain results. We assess
the accuracy of these results in light of a three-month experimentation
conducted aboard buses equipped with Wi-Fi sensors in a sizable French
conurbation. We put forward a method to quantify the error between the
stop-to-stop origin-destination (O-D) matrix produced by Wi-Fi data and the
ground truth, when the (estimated and real) volumes per boarding and alighting
are known. To do so, the error in the estimated matrix is modeled by random
noise. Neither additive, nor multiplicative noise replicate the experimental
results. Noise models that concentrate on the short O-D trips and/or the
central stops better reflect the structure of the error. But only by
introducing distinct uncertainties between the boarding stop and the alighting
stop can we recover the asymmetry between the alighting and boarding errors, as
well as the correct ratios between these aggregate errors and the O-D error.
Thus, our findings give insight into the main sources of error in the Wi-Fi
based reconstruction of O-D matrices. They also provide analysts with an
automatic and reproducible way to control the quality of O-D matrices produced
by Wi-Fi data, using (readily available) count data.
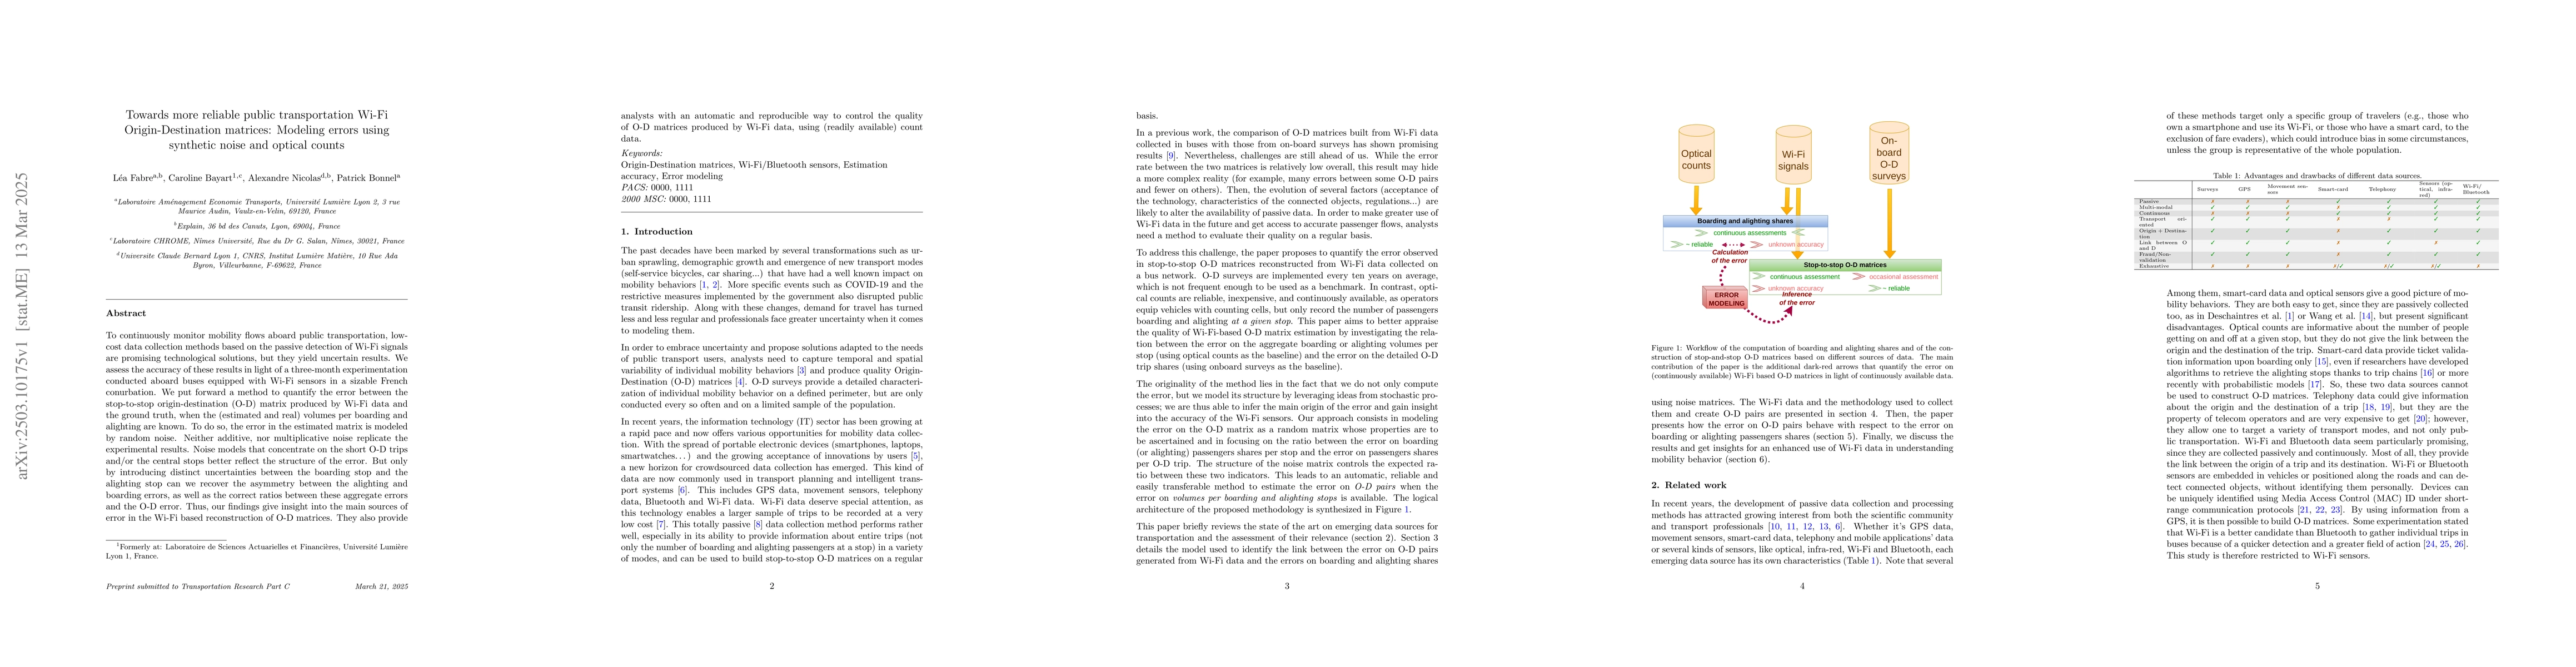
Discussion 0