ArxivLens

Quick Summary:

This paper introduces graphVizdb, a disk-based infrastructure for visualizing and exploring very large RDF graphs. It employs an R-tree spatial data structure for indexing and efficient storage, enabling effective runtime spatial queries for user operations.

arXiv Id: 1506.04333
Comments: 12th Extended Semantic Web Conference (ESWC 2015)
Date Published: 2015-06-18
Date Updated: 2015-06-18

Categories:

Key Terms (TF-IDF):

operations (0.385)
graph (0.298)
spatial (0.244)
layout (0.232)
efficient (0.225)
stored (0.225)
queries (0.208)
infrastructure (0.206)
window (0.205)
platform (0.198)
database (0.197)
exploration (0.195)
developing (0.184)
tree (0.181)
disk (0.170)
user (0.165)
graphs (0.162)
particularly (0.161)
technique (0.147)
based (0.140)
License: http://arxiv.org/licenses/nonexclusive-distrib/1.0/

Summary:

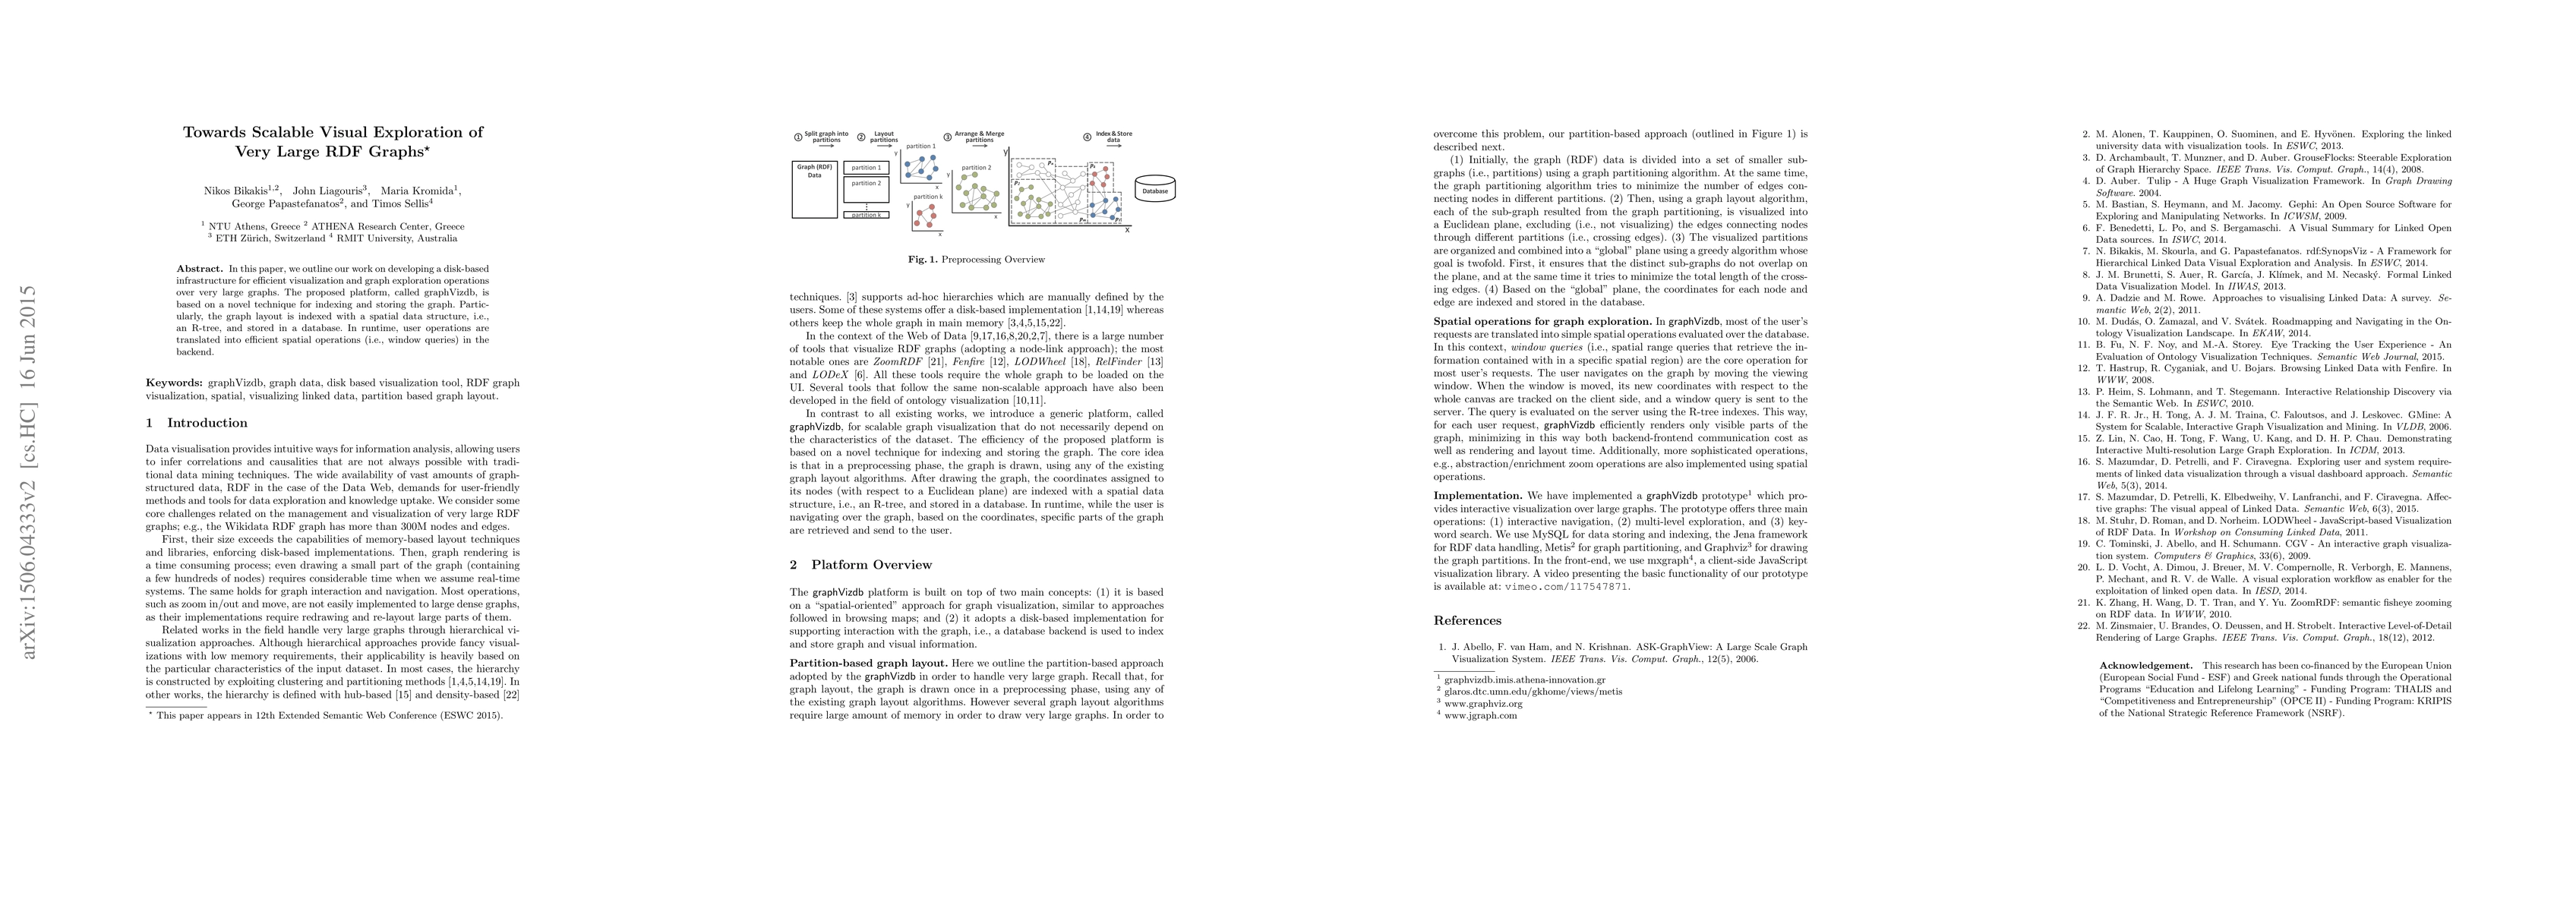
In this paper, we outline our work on developing a disk-based infrastructure for efficient visualization and graph exploration operations over very large graphs. The proposed platform, called graphVizdb, is based on a novel technique for indexing and storing the graph. Particularly, the graph layout is indexed with a spatial data structure, i.e., an R-tree, and stored in a database. In runtime, user operations are translated into efficient spatial operations (i.e., window queries) in the backend.

Citation & Reference Network Visualization

This graph shows how this paper is connected to other research. The current paper is shown in dark gray, papers that cite it are in green, and papers it references are in blue. You can:

Current Paper
Papers citing this work (Citations)
Papers cited by this work (References)

• Hover over any node to see the paper title

• Click a node to view that paper's details

• Drag nodes to rearrange the graph

• Use the zoom controls (bottom right) to zoom in/out

Citations and References

Title Authors Year Actions
Resource-aware adaptive indexing for in situ visual exploration and analytics
Stavros Maroulis, Nikos Bikakis, George Papastefanatos, Panos Vassiliadis, Y. Vassiliou
2022
View Paper
A spiral-like method to place in the space (and interact with) too many values
Yannis Tzitzikas, Maria-Evangelia Papadaki, Manos Chatzakis
2021
View Paper
Empirical evaluation of Linked Data visualization tools
F. Desimoni, Laura Po
2020
View Paper
Linked Data Visualization: Techniques, Tools, and Big Data
Laura Po, Nikos Bikakis, F. Desimoni, George Papastefanatos
2020
View Paper
Customising LOD views: a declarative approach
Alice Graziosi, A. Iorio, Francesco Poggi, S. Peroni, Luca Bonini
2018
View Paper
VIZ-VIVO: Towards Visualizations-driven Linked Data Navigation
M. Javed, Sandra Payette, J. Blake, Tim Worrall
2016
View Paper
Enabling graph mining in RDF triplestores using SPARQL for holistic in-situ graph analysis
S. Lee, S. Sukumar, Seokyong Hong, Seung-Hwan Lim
2016
View Paper
graphVizdb: A scalable platform for interactive large graph visualization
Nikos Bikakis, J. Liagouris, Maria Krommyda, George Papastefanatos, T. Sellis
2016
View Paper
Exploration and Visualization in the Web of Big Linked Data: A Survey of the State of the Art
Nikos Bikakis, T. Sellis
2016
View Paper
A hierarchical aggregation framework for efficient multilevel visual exploration and analysis
Nikos Bikakis, George Papastefanatos, Melina Skourla, T. Sellis
2015
View Paper
A Hierarchical Framework for Efficient Multilevel Visual Exploration and Analysis
Nikos Bikakis, George Papastefanatos, Melina Skourla, T. Sellis
2015
View Paper
Stunning Doodle: A Tool for Joint Visualization and Analysis of Knowledge Graphs and Graph Embeddings
Antonia Ettorre, A. Bobasheva, Franck Michel, C. Faron-Zucker
2022
View Paper
In-situ visual exploration over big raw data
Nikos Bikakis, Stavros Maroulis, George Papastefanatos, Panos Vassiliadis
2021
View Paper
Adaptive Indexing for In-situ Visual Exploration and Analytics
Stavros Maroulis, Nikos Bikakis, George Papastefanatos, Panos Vassiliadis, Y. Vassiliou
2021
View Paper
Visualization of path patterns in semantic graphs
José Paulo Leal
2020
View Paper
Interactive Graph Data Integration System With Spatial-Oriented Visualization and Feedback-Driven Provenance
K. Reddy
2019
View Paper
Adaptive, efficient and effective graph data integration and search framework
K. Reddy
2019
View Paper
Taming a Graph Hairball: Local Exploration in a Global Context
J. Abello, Daniel Mawhirter, Kevin Sun
2019
View Paper
Linked Data Visualization Tools
C.Ramesh, K. Rao, A. Govardhan
2019
View Paper
International Journal of Web Information Systems MATVIZ : A Semantic Query and Visualization Approach for Metallic Materials Data
Xiaoming Zhang, Huilin Chen, Yanqin Ruan, Dongyu Pan, Chongchong Zhao
2017
View Paper
Scholars@Cornell: Visualizing the Scholarship Data
Javed Muhammad
2017
View Paper

Comments (0)

This website uses cookies to ensure you get the best experience. Learn more