Summary
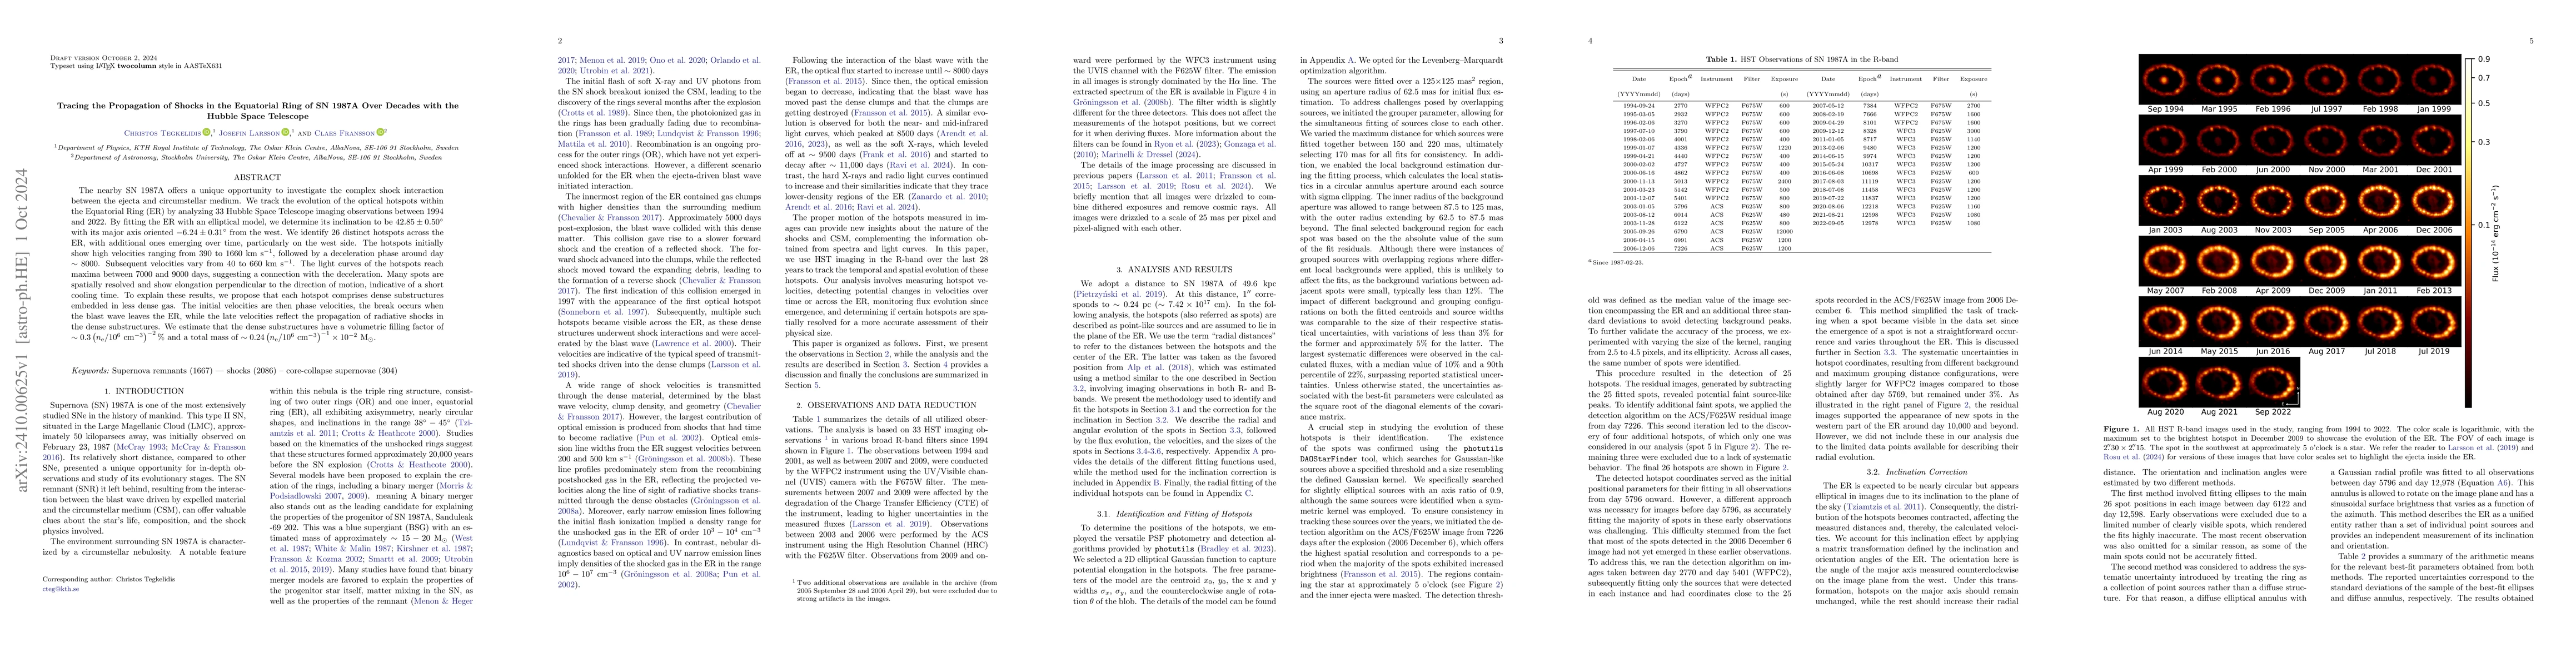
The nearby SN 1987A offers a unique opportunity to investigate the complex shock interaction between the ejecta and circumstellar medium. We track the evolution of the optical hotspots within the Equatorial Ring (ER) by analyzing 33 Hubble Space Telescope imaging observations between 1994 and 2022. By fitting the ER with an elliptical model, we determine its inclination to be $ 42.85 \pm 0.50^{\circ}$ with its major axis oriented $ -6.24 \pm 0.31^{\circ}$ from the west. We identify 26 distinct hotspots across the ER, with additional ones emerging over time, particularly on the west side. The hotspots initially show high velocities ranging from $390$ to $1660 \ \rm km \ s^{-1}$, followed by a deceleration phase around day $\sim 8000$. Subsequent velocities vary from $40$ to $660 \ \rm km \ s^{-1}$. The light curves of the hotspots reach maxima between 7000 and 9000 days, suggesting a connection with the deceleration. Many spots are spatially resolved and show elongation perpendicular to the direction of motion, indicative of a short cooling time. To explain these results, we propose that each hotspot comprises dense substructures embedded in less dense gas. The initial velocities are then phase velocities, the break occurs when the blast wave leaves the ER, while the late velocities reflect the propagation of radiative shocks in the dense substructures. We estimate that the dense substructures have a volumetric filling factor of $\sim0.3 \left( n_{\mathrm{e}}/10^{6}\ \mathrm{cm^{-3}} \right)^{-2} \%$ and a total mass of $\sim0.24 \left(n_{\mathrm{e}}/10^{6}\ \mathrm{cm^{-3}} \right)^{-1}\times10^{-2}\ \mathrm{M_{\odot}}$.
AI Key Findings
Get AI-generated insights about this paper's methodology, results, and significance.
Paper Details
PDF Preview
Citation Network
Current paper (gray), citations (green), references (blue)
Display is limited for performance on very large graphs.
Similar Papers
Found 4 papersHubble Space Telescope images of SN 1987A: Evolution of the ejecta and the equatorial ring from 2009 to 2022
Tuomas Kangas, Peter Lundqvist, Claes Fransson et al.
Near-infrared evolution of the equatorial ring of SN 1987A
S. Mattila, C. Fransson, P. Lundqvist et al.
No citations found for this paper.
Comments (0)