Quick Answers
What methodology did the authors use?
The study introduces post‑hoc metrics computed from full temporal sequences and evaluates them on the Wild‑Time Yearbook and FMoW‑Time classification benchmarks, comparing several learning paradigms. More in Methodology →
What are the key results?
The Temporal Adaptation Score, Stability Horizon, and Drift Horizon successfully separate model adaptation failures from intrinsic data difficulty, revealing hidden temporal dynamics. — Experiments show that models with similar ID/OOD accuracy can differ markedly in TAS, SH, and DH, indicating that relative adaptation and temporal stability vary across methods. More in Key Results →
Why is this work significant?
By providing a dynamic, interpretable framework, the metrics enable practitioners to detect when models truly fail to adapt versus when data becomes harder, guiding more efficient retraining decisions. More in Significance →
What are the main limitations?
Metrics require full temporal supervision and post‑hoc analysis, limiting real‑time applicability. — Evaluation is confined to image classification benchmarks, leaving generalization to other tasks untested. More in Limitations →
Abstract
Evaluating robustness under temporal distribution shift remains an open challenge. Existing metrics quantify the average decline in performance, but fail to capture how models adapt to evolving data. As a result, temporal degradation is often misinterpreted: when accuracy declines, it is unclear whether the model is failing to adapt or whether the data itself has become inherently more challenging to learn. In this work, we propose three complementary metrics to distinguish adaptation from intrinsic difficulty in the data. Together, these metrics provide a dynamic and interpretable view of model behavior under temporal distribution shift. Results show that our metrics uncover adaptation patterns hidden by existing analysis, offering a richer understanding of temporal robustness in evolving environments.
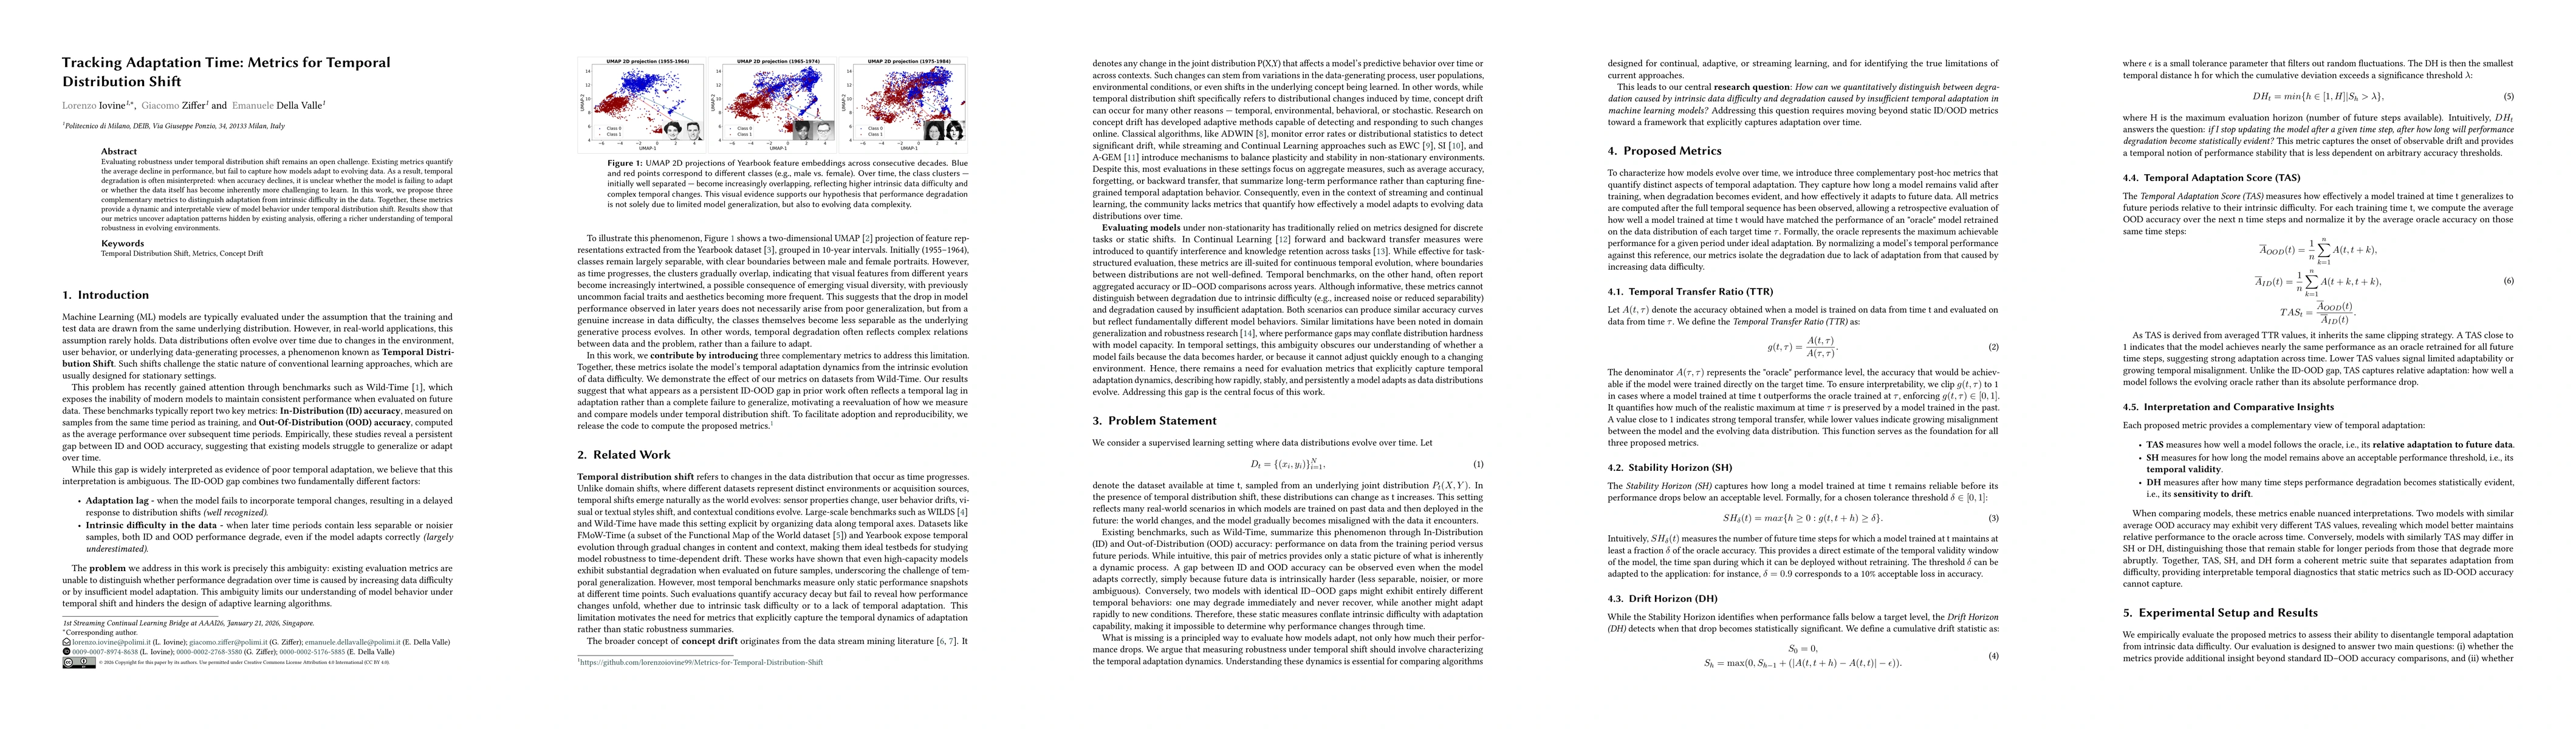
AI Key Findings
Generated Apr 09, 2026
Methodology — What approach did the authors take?
The study introduces post‑hoc metrics computed from full temporal sequences and evaluates them on the Wild‑Time Yearbook and FMoW‑Time classification benchmarks, comparing several learning paradigms.
Key Results — What are the main findings?
- The Temporal Adaptation Score, Stability Horizon, and Drift Horizon successfully separate model adaptation failures from intrinsic data difficulty, revealing hidden temporal dynamics.
- Experiments show that models with similar ID/OOD accuracy can differ markedly in TAS, SH, and DH, indicating that relative adaptation and temporal stability vary across methods.
- Fine‑Tuning achieves an average Stability Horizon of ~5 years and a Drift Horizon of ~6 years on FMoW, demonstrating that acceptable performance can persist longer than absolute accuracy suggests.
Significance — Why does this research matter?
By providing a dynamic, interpretable framework, the metrics enable practitioners to detect when models truly fail to adapt versus when data becomes harder, guiding more efficient retraining decisions.
Technical Contribution — What is the technical contribution?
Formal definitions of Temporal Transfer Ratio, Stability Horizon, Drift Horizon, and Temporal Adaptation Score, together with a framework for post‑hoc evaluation of temporal adaptation.
Novelty — What is new about this work?
This work is the first to explicitly disentangle adaptation from intrinsic data difficulty using complementary post‑hoc metrics, offering a richer temporal robustness analysis than traditional ID/OOD accuracy.
Limitations — What are the limitations of this study?
- Metrics require full temporal supervision and post‑hoc analysis, limiting real‑time applicability.
- Evaluation is confined to image classification benchmarks, leaving generalization to other tasks untested.
Future Work — What did the authors propose for future work?
- Develop online approximations of the metrics to estimate adaptation dynamics during deployment.
- Integrate the metrics into active retraining or model‑selection strategies to automate retraining triggers.
Paper Details
How to Cite This Paper
@article{valle2026tracking,
title = {Tracking Adaptation Time: Metrics for Temporal Distribution Shift},
author = {Valle, Emanuele Della and Ziffer, Giacomo and Iovine, Lorenzo},
year = {2026},
eprint = {2604.07266},
archivePrefix = {arXiv},
primaryClass = {cs.LG},
}
Valle, E., Ziffer, G., & Iovine, L. (2026). Tracking Adaptation Time: Metrics for Temporal Distribution Shift. arXiv. https://arxiv.org/abs/2604.07266
Valle, Emanuele Della, et al. "Tracking Adaptation Time: Metrics for Temporal Distribution Shift." arXiv, 2026, arxiv.org/abs/2604.07266.
PDF Preview
Similar Papers
Found 4 papersLabel Distribution Shift-Aware Prediction Refinement for Test-Time Adaptation
Hye Won Chung, Minguk Jang
CANDI: Curated Test-Time Adaptation for Multivariate Time-Series Anomaly Detection Under Distribution Shift
HyunGi Kim, Jisoo Mok, Hyungyu Lee et al.
Test-time Similarity Modification for Person Re-identification toward Temporal Distribution Shift
Kazuki Adachi, Shohei Enomoto, Taku Sasaki et al.
Comments (0)