Publication
Metrics
AI Quick Summary
This paper proposes a new method to continuously track the system temperature ($T_{sys}$) for high-frequency observations at ALMA using water vapor radiometer (WVR) data, demonstrating a tight linear correlation with traditional methods and reducing the need for frequent atmospheric calibrations. The method shows consistent flux measurements with reduced uncertainties.
Paper Preview
Abstract
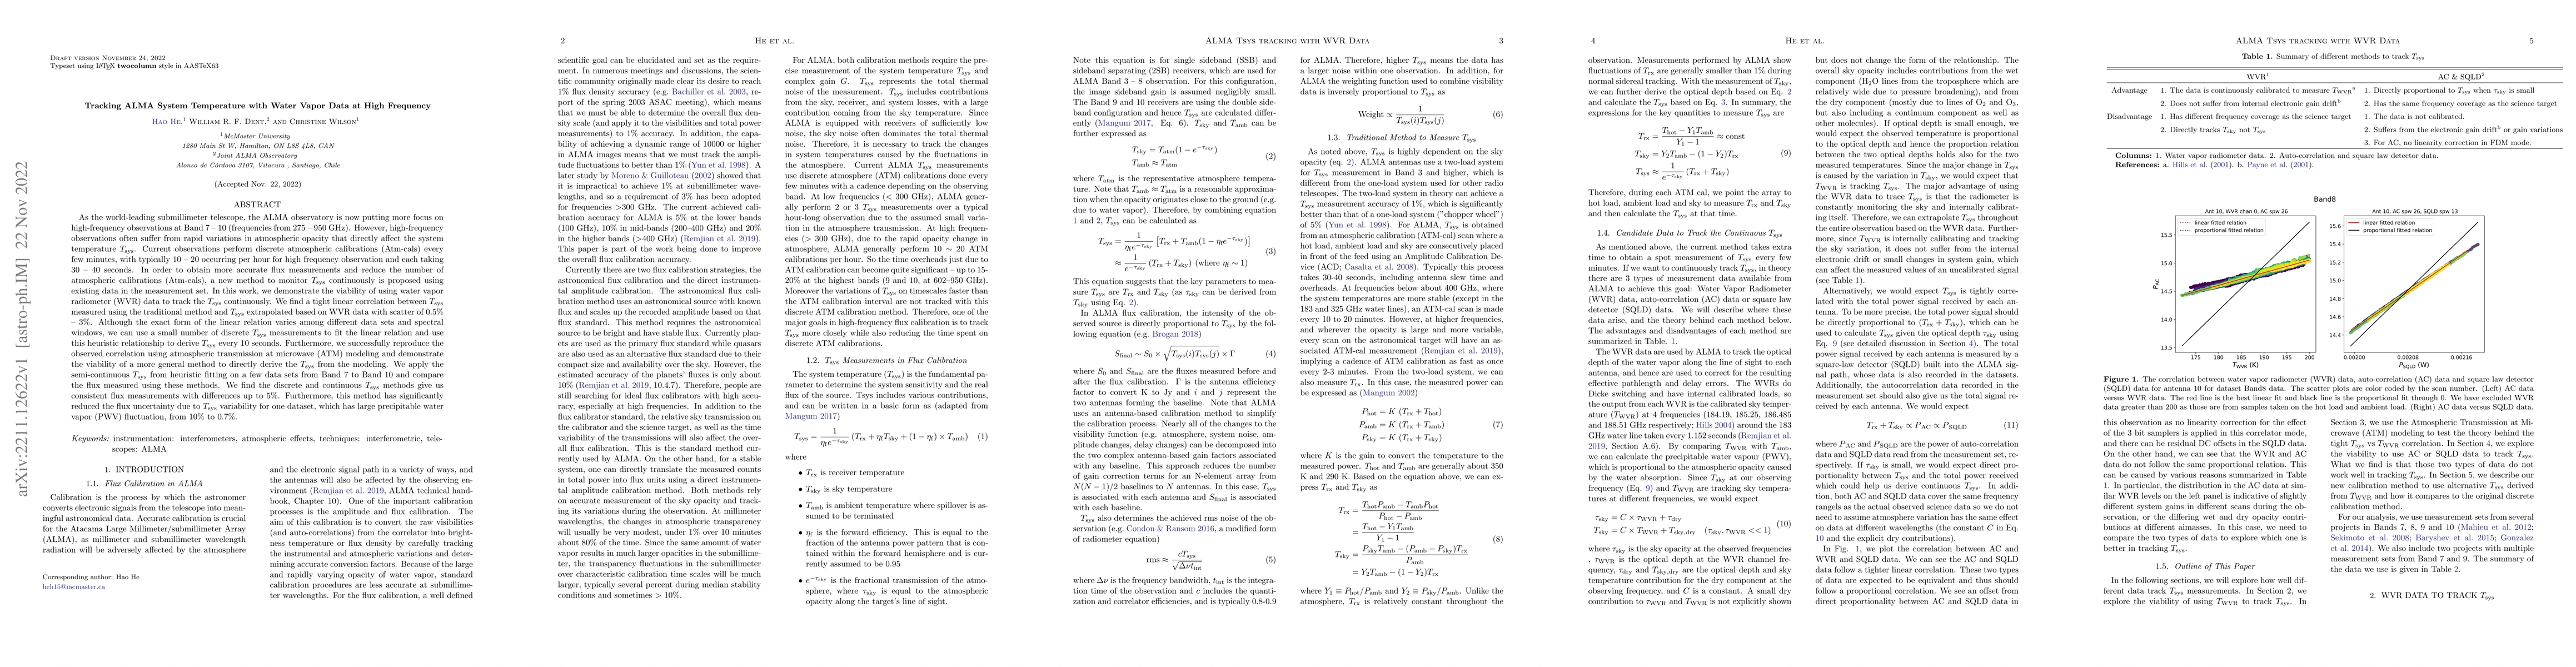
The ALMA observatory is now putting more focus on high-frequency observations (frequencies from 275-950 GHz). However, high-frequency observations often suffer from rapid variations in atmospheric opacity that directly affect the system temperature $T_{sys}$. Current observations perform discrete atmospheric calibrations (Atm-cals) every few minutes, with typically 10-20 occurring per hour for high frequency observation and each taking 30-40 seconds. In order to obtain more accurate flux measurements and reduce the number of atmospheric calibrations (Atm-cals), a new method to monitor $T_{sys}$ continuously is proposed using existing data in the measurement set. In this work, we demonstrate the viability of using water vapor radiometer (WVR) data to track the $T_{sys}$ continuously. We find a tight linear correlation between $T_{sys}$ measured using the traditional method and $T_{sys}$ extrapolated based on WVR data with scatter of 0.5-3%. Although the exact form of the linear relation varies among different data sets and spectral windows, we can use a small number of discrete $T_{sys}$ measurements to fit the linear relation and use this heuristic relationship to derive $T_{sys}$ every 10 seconds. Furthermore, we successfully reproduce the observed correlation using atmospheric transmission at microwave (ATM) modeling and demonstrate the viability of a more general method to directly derive the $T_{sys}$ from the modeling. We apply the semi-continuous $T_{sys}$ from heuristic fitting on a few data sets from Band 7 to Band 10 and compare the flux measured using these methods. We find the discrete and continuous $T_{sys}$ methods give us consistent flux measurements with differences up to 5%. Furthermore, this method has significantly reduced the flux uncertainty due to $T_{sys}$ variability for one dataset, which has large precipitable water vapor (PWV) fluctuation, from 10% to 0.7%.
AI Key Findings
Get AI-generated insights about this paper's methodology, results, significance, and more — seven facets brought into focus.
Impact
Paper Details
Authors
PDF Preview
Key Terms
Citation Network
Current paper (gray), citations (green), references (blue)
Display is limited for performance on very large graphs.
Discussion 0