Publication
Metrics
AI Quick Summary
A new method using optical/IR emission lines to track X-ray outflows in galaxies has been developed, allowing for accurate kinematics and physical conditions of AGN ionised gas to be measured.
Paper Preview
Abstract
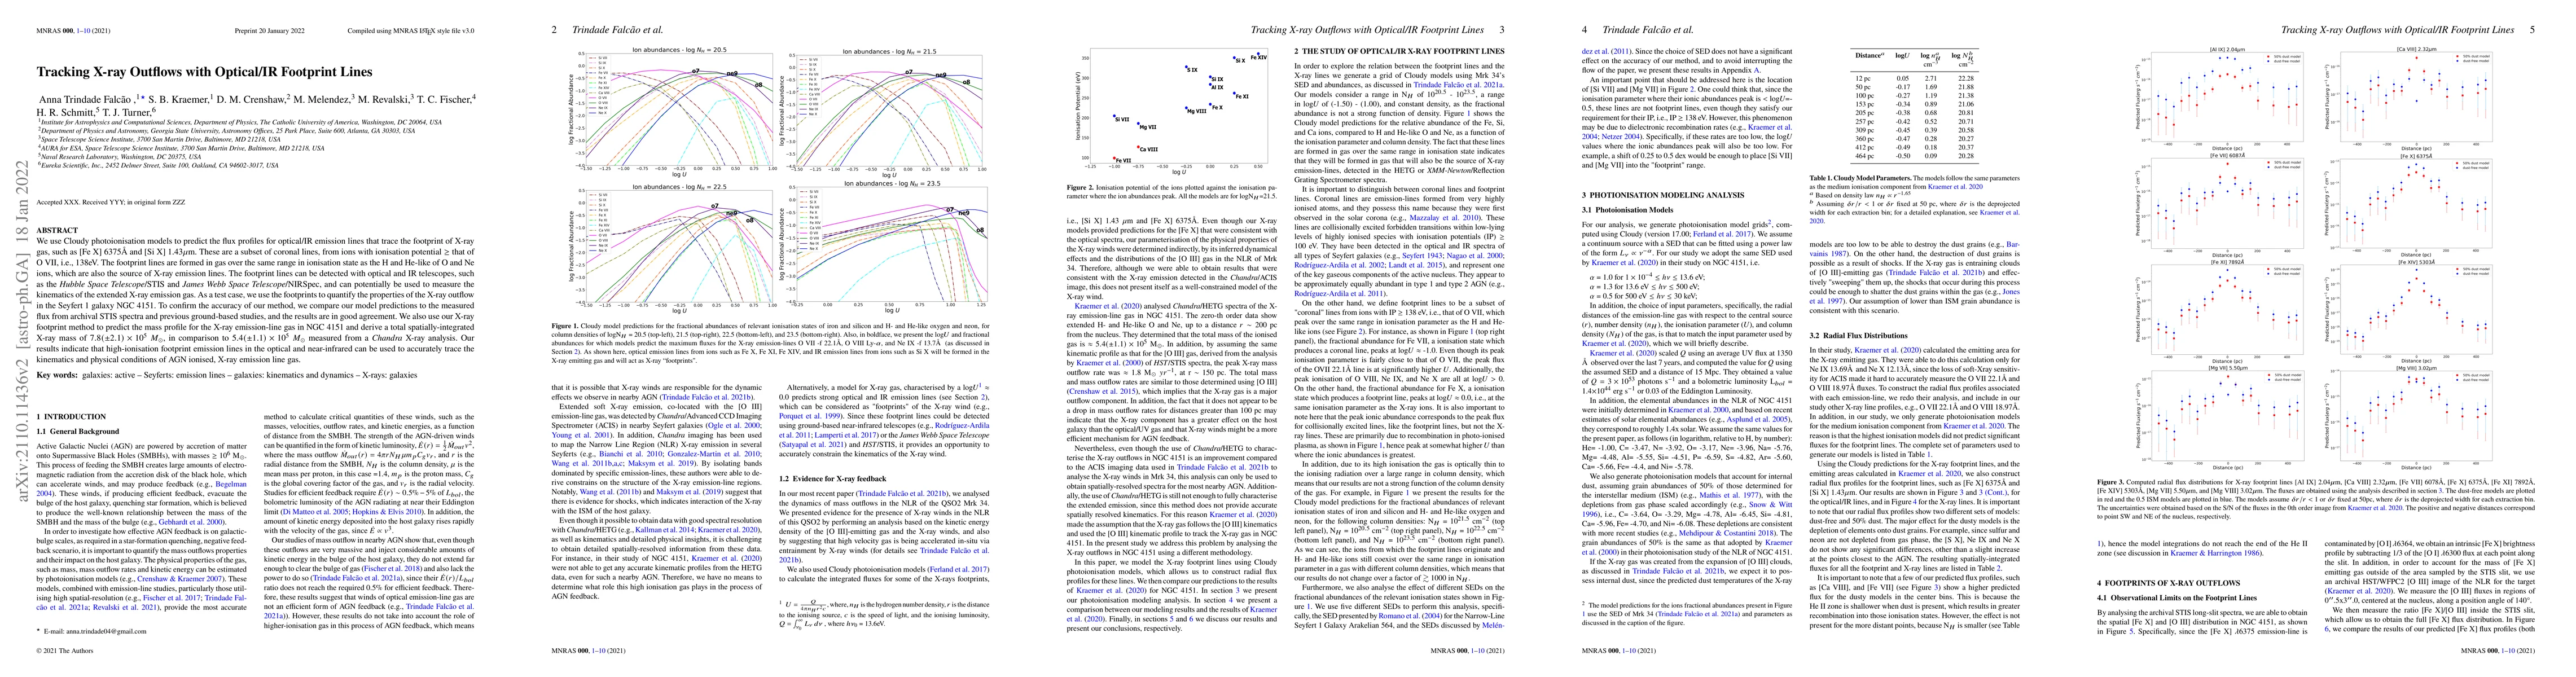
We use Cloudy photoionisation models to predict the flux profiles for optical/IR emission lines that trace the footprint of X-ray gas, such as [Fe X] 6375A and [Si X] 1.43$\mu$m. These are a subset of coronal lines, from ions with ionisation potential $\geq$ that of O VII, i.e., 138eV. The footprint lines are formed in gas over the same range in ionisation state as the H and He-like of O and Ne ions, which are also the source of X-ray emission lines. The footprint lines can be detected with optical and IR telescopes, such as the Hubble Space Telescope/STIS and James Webb Space Telescope/NIRSpec, and can potentially be used to measure the kinematics of the extended X-ray emission gas. As a test case, we use the footprints to quantify the properties of the X-ray outflow in the Seyfert 1 galaxy NGC 4151. To confirm the accuracy of our method, we compare our model predictions to the measured flux from archival STIS spectra and previous ground-based studies, and the results are in good agreement. We also use our X-ray footprint method to predict the mass profile for the X-ray emission-line gas in NGC 4151 and derive a total spatially-integrated X-ray mass of $7.8(\pm 2.1) \times 10^{5}~M_{\odot}$, in comparison to $5.4(\pm 1.1) \times 10^{5}~M_{\odot}$ measured from a Chandra X-ray analysis. Our results indicate that high-ionisation footprint emission lines in the optical and near-infrared can be used to accurately trace the kinematics and physical conditions of AGN ionised, X-ray emission-line gas.
AI Key Findings
Get AI-generated insights about this paper's methodology, results, significance, and more — seven facets brought into focus.
Impact
Paper Details
Authors
PDF Preview
Key Terms
Citation Network
Current paper (gray), citations (green), references (blue)
Display is limited for performance on very large graphs.
Discussion 0