Publication
Metrics
AI Quick Summary
The trackr framework enhances the discoverability and reproducibility of data visualizations and other artifacts in R by automatically extracting metadata and organizing results. It provides an extensible system for annotating and searching computational results based on metadata, facilitating the iterative process of scientific research.
Paper Preview
Abstract
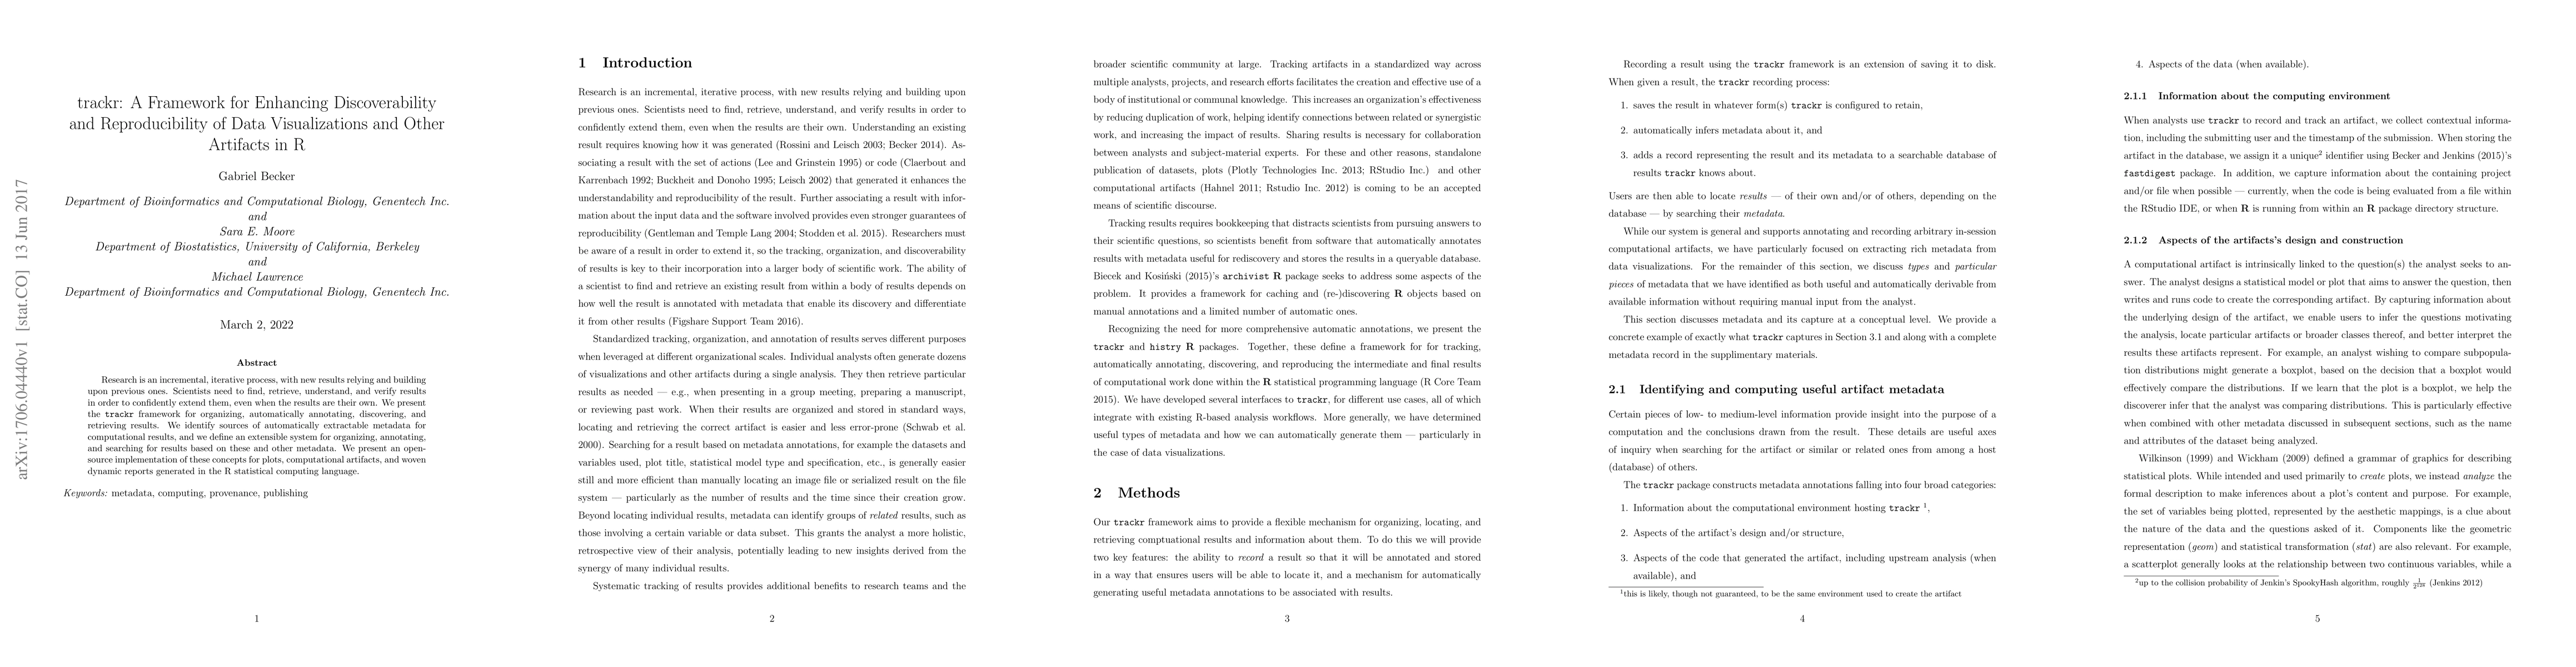
Research is an incremental, iterative process, with new results relying and building upon previous ones. Scientists need to find, retrieve, understand, and verify results in order to confidently extend them, even when the results are their own. We present the trackr framework for organizing, automatically annotating, discovering, and retrieving results. We identify sources of automatically extractable metadata for computational results, and we define an extensible system for organizing, annotating, and searching for results based on these and other metadata. We present an open-source implementation of these concepts for plots, computational artifacts, and woven dynamic reports generated in the R statistical computing language.
AI Key Findings
Get AI-generated insights about this paper's methodology, results, significance, and more — seven facets brought into focus.
Impact
Paper Details
Authors
PDF Preview
Key Terms
Citation Network
Current paper (gray), citations (green), references (blue)
Display is limited for performance on very large graphs.
Discussion 0