Tradeoff of generalization error in unsupervised learning
Publication
Metrics
AI Quick Summary
This paper explores the generalization error tradeoff in unsupervised learning, proposing a two-component tradeoff between model error and data error. It finds that more complex models reduce model error but increase data error, especially with smaller datasets, and suggests that optimal complexity depends on the inherent complexity of the data.
Paper Preview
Abstract
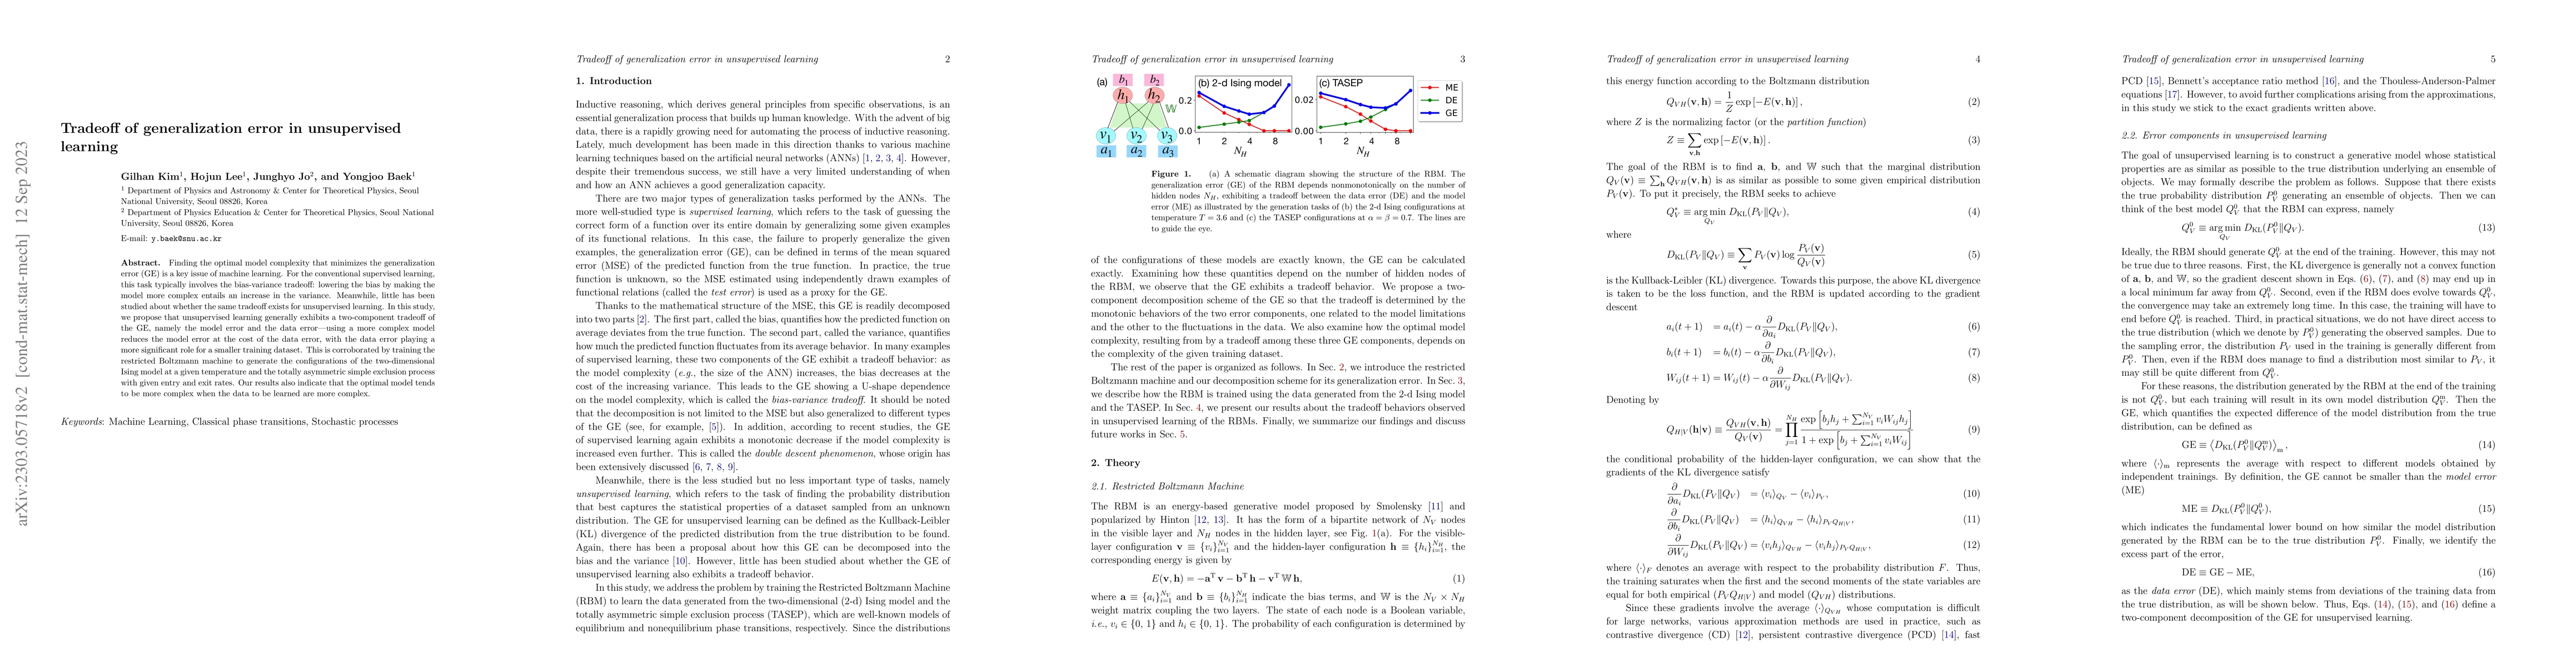
Finding the optimal model complexity that minimizes the generalization error (GE) is a key issue of machine learning. For the conventional supervised learning, this task typically involves the bias-variance tradeoff: lowering the bias by making the model more complex entails an increase in the variance. Meanwhile, little has been studied about whether the same tradeoff exists for unsupervised learning. In this study, we propose that unsupervised learning generally exhibits a two-component tradeoff of the GE, namely the model error and the data error -- using a more complex model reduces the model error at the cost of the data error, with the data error playing a more significant role for a smaller training dataset. This is corroborated by training the restricted Boltzmann machine to generate the configurations of the two-dimensional Ising model at a given temperature and the totally asymmetric simple exclusion process with given entry and exit rates. Our results also indicate that the optimal model tends to be more complex when the data to be learned are more complex.
AI Key Findings
Get AI-generated insights about this paper's methodology, results, significance, and more — seven facets brought into focus.
Impact
Paper Details
Authors
PDF Preview
Key Terms
Citation Network
Current paper (gray), citations (green), references (blue)
Display is limited for performance on very large graphs.
Discussion 0