Training Neural Machine Translation (NMT) Models using Tensor Train Decomposition on TensorFlow (T3F)
Publication
Metrics
AI Quick Summary
This paper explores the use of Tensor Train decomposition in TensorFlow for Neural Machine Translation (NMT) models, achieving competitive BLEU scores on IWSLT and WMT datasets. Higher learning rates and more rectangular core dimensions generally yield better translation performance.
Paper Preview
Abstract
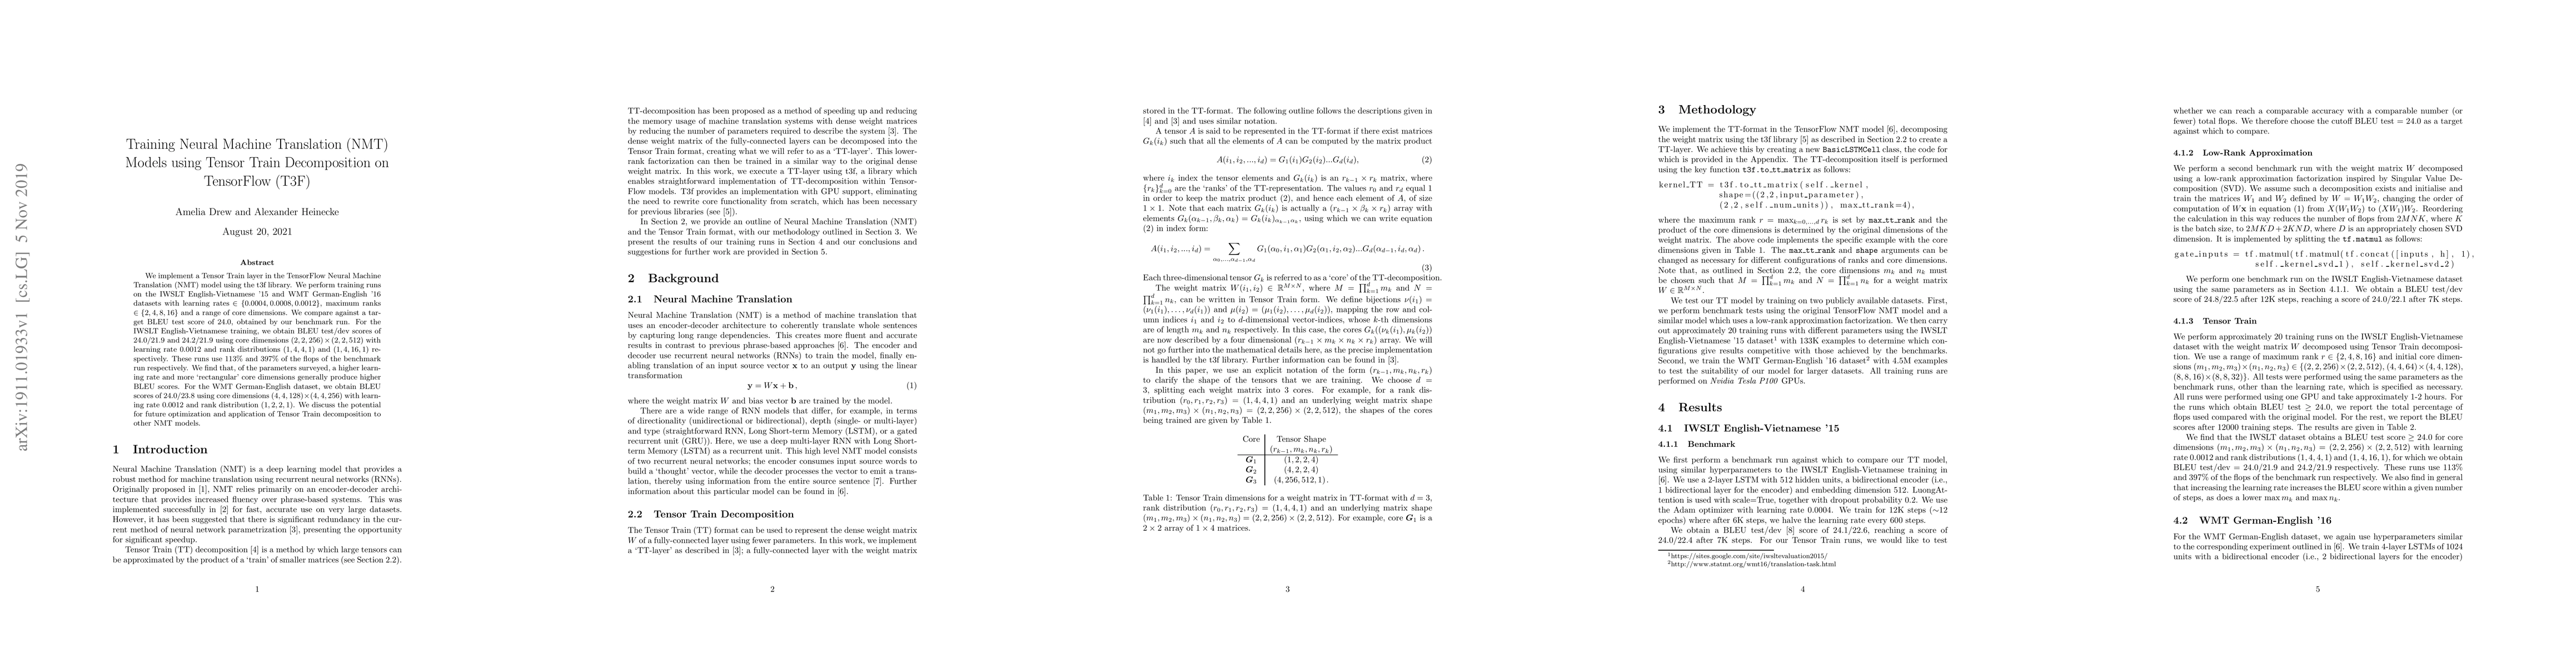
We implement a Tensor Train layer in the TensorFlow Neural Machine Translation (NMT) model using the t3f library. We perform training runs on the IWSLT English-Vietnamese '15 and WMT German-English '16 datasets with learning rates $\in \{0.0004,0.0008,0.0012\}$, maximum ranks $\in \{2,4,8,16\}$ and a range of core dimensions. We compare against a target BLEU test score of 24.0, obtained by our benchmark run. For the IWSLT English-Vietnamese training, we obtain BLEU test/dev scores of 24.0/21.9 and 24.2/21.9 using core dimensions $(2, 2, 256) \times (2, 2, 512)$ with learning rate 0.0012 and rank distributions $(1,4,4,1)$ and $(1,4,16,1)$ respectively. These runs use 113\% and 397\% of the flops of the benchmark run respectively. We find that, of the parameters surveyed, a higher learning rate and more `rectangular' core dimensions generally produce higher BLEU scores. For the WMT German-English dataset, we obtain BLEU scores of 24.0/23.8 using core dimensions $(4, 4, 128) \times (4, 4, 256)$ with learning rate 0.0012 and rank distribution $(1,2,2,1)$. We discuss the potential for future optimization and application of Tensor Train decomposition to other NMT models.
AI Key Findings
Get AI-generated insights about this paper's methodology, results, significance, and more — seven facets brought into focus.
Impact
Paper Details
Authors
PDF Preview
Key Terms
Citation Network
Current paper (gray), citations (green), references (blue)
Display is limited for performance on very large graphs.
Discussion 0