Trajectory Flow Map: Graph-based Approach to Analysing Temporal Evolution of Aggregated Traffic Flows in Large-scale Urban Networks
Publication
Metrics
AI Quick Summary
This paper introduces a graph-based method to visualize and analyze city-wide traffic dynamics using spatio-temporal trajectory data. It constructs dynamic graphs from aggregated traffic flows, applying graph mining to detect significant changes in urban mobility patterns.
Paper Preview
Abstract
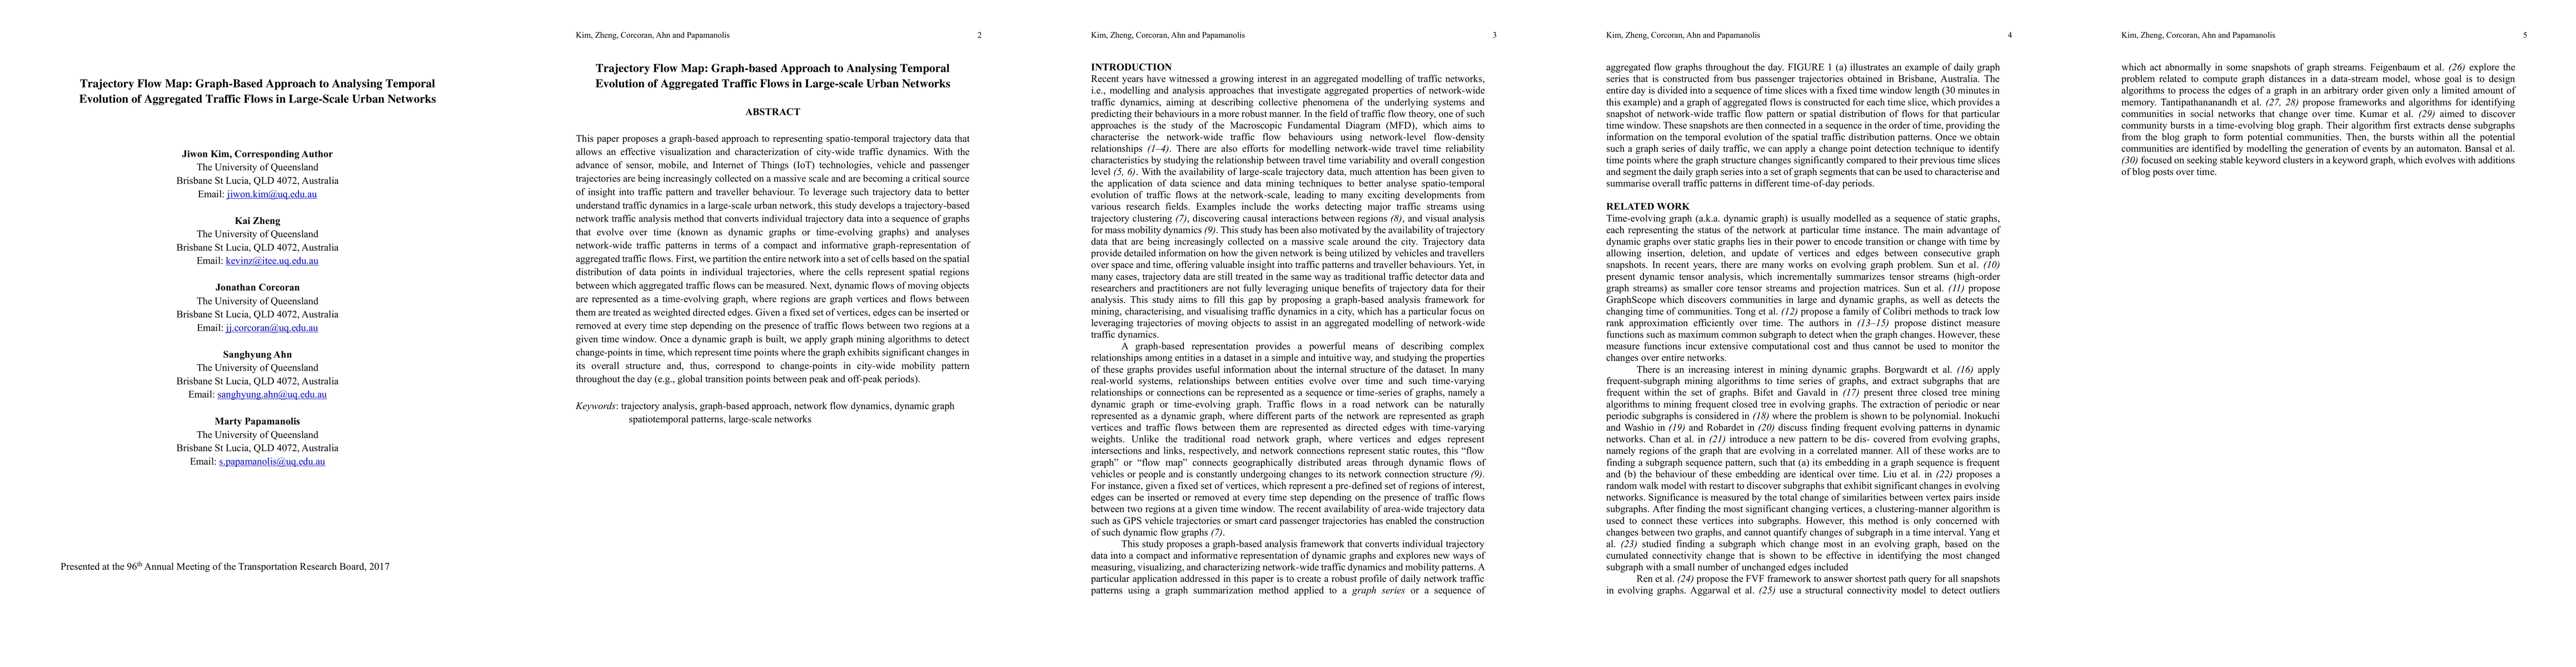
This paper proposes a graph-based approach to representing spatio-temporal trajectory data that allows an effective visualization and characterization of city-wide traffic dynamics. With the advance of sensor, mobile, and Internet of Things (IoT) technologies, vehicle and passenger trajectories are being increasingly collected on a massive scale and are becoming a critical source of insight into traffic pattern and traveller behaviour. To leverage such trajectory data to better understand traffic dynamics in a large-scale urban network, this study develops a trajectory-based network traffic analysis method that converts individual trajectory data into a sequence of graphs that evolve over time (known as dynamic graphs or time-evolving graphs) and analyses network-wide traffic patterns in terms of a compact and informative graph-representation of aggregated traffic flows. First, we partition the entire network into a set of cells based on the spatial distribution of data points in individual trajectories, where the cells represent spatial regions between which aggregated traffic flows can be measured. Next, dynamic flows of moving objects are represented as a time-evolving graph, where regions are graph vertices and flows between them are treated as weighted directed edges. Given a fixed set of vertices, edges can be inserted or removed at every time step depending on the presence of traffic flows between two regions at a given time window. Once a dynamic graph is built, we apply graph mining algorithms to detect change-points in time, which represent time points where the graph exhibits significant changes in its overall structure and, thus, correspond to change-points in city-wide mobility pattern throughout the day (e.g., global transition points between peak and off-peak periods).
AI Key Findings
Get AI-generated insights about this paper's methodology, results, significance, and more — seven facets brought into focus.
Impact
Paper Details
Authors
PDF Preview
Key Terms
Citation Network
Current paper (gray), citations (green), references (blue)
Display is limited for performance on very large graphs.
Discussion 0