Publication
Metrics
AI Quick Summary
This paper introduces two new exploratory tools—trajectory functional boxplots and the modified simplicial band depth (MSBD) versus Wiggliness of Directional Outlyingness (WO) plot—to visualize and detect outliers in multivariate functional data, specifically trajectory functional data. The WO index measures shape variation, while MSBD ranks centrality, both aiding in identifying outliers in the data.
Paper Preview
Abstract
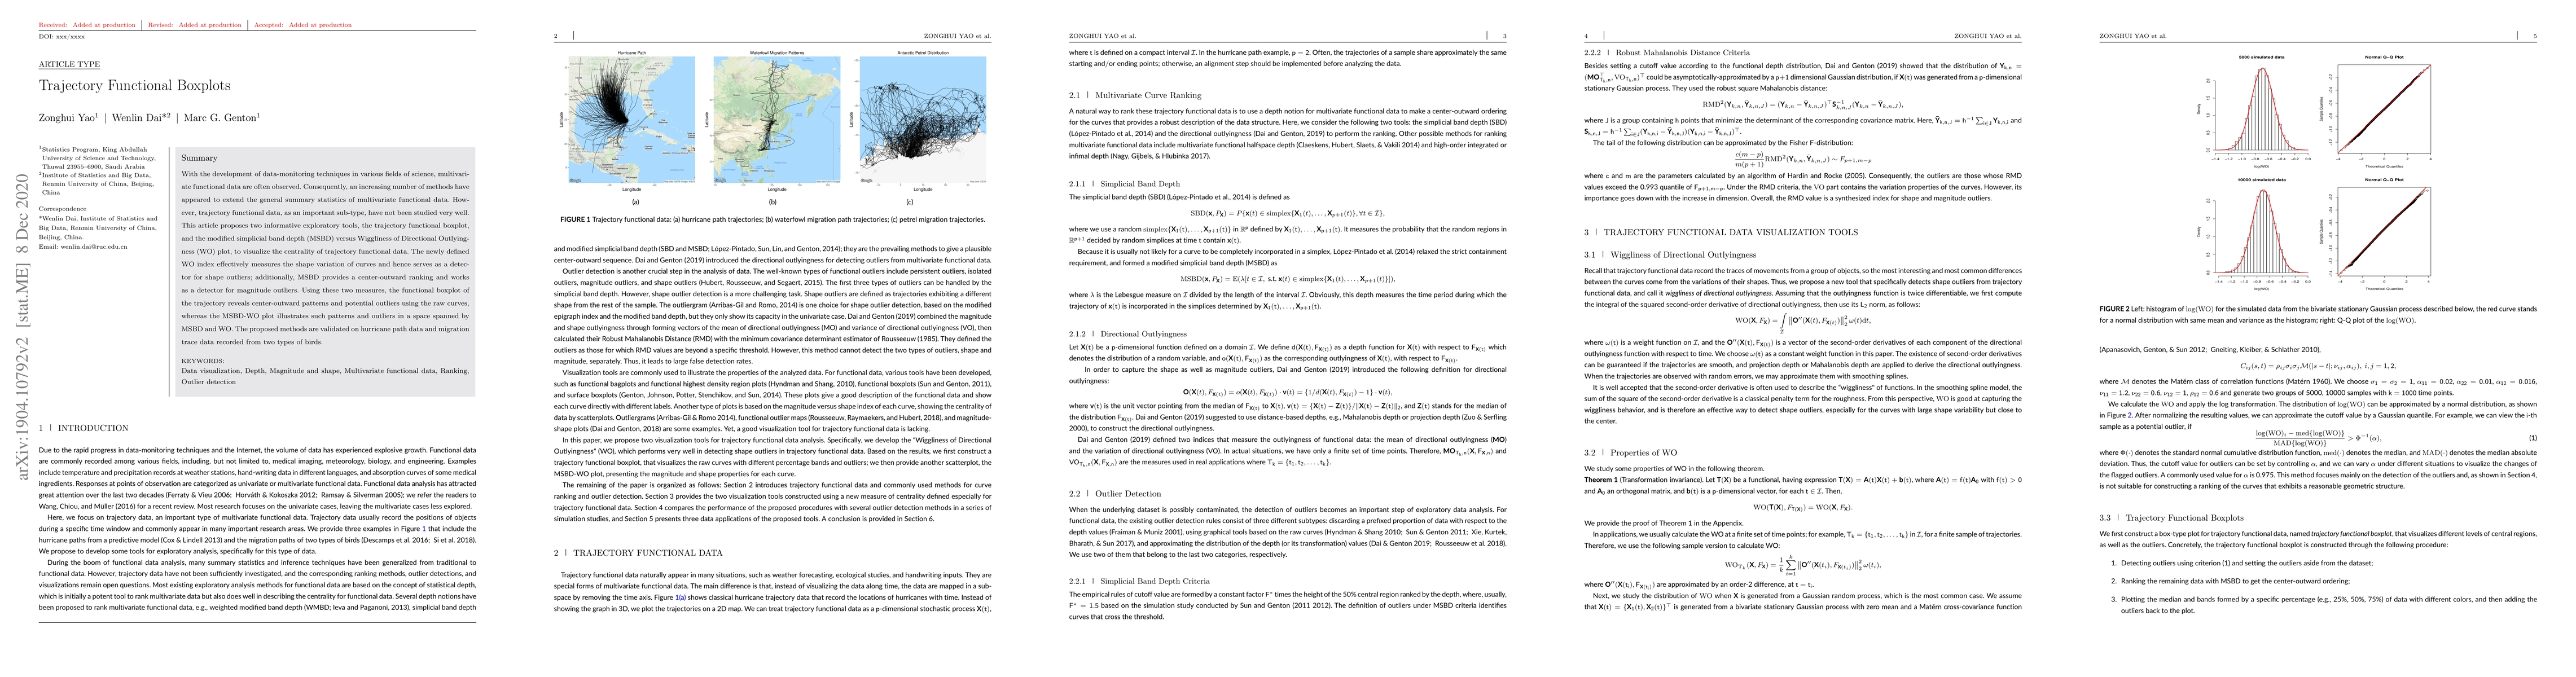
With the development of data-monitoring techniques in various fields of science, multivariate functional data are often observed. Consequently, an increasing number of methods have appeared to extend the general summary statistics of multivariate functional data. However, trajectory functional data, as an important sub-type, have not been studied very well. This article proposes two informative exploratory tools, the trajectory functional boxplot, and the modified simplicial band depth (MSBD) versus Wiggliness of Directional Outlyingness (WO) plot, to visualize the centrality of trajectory functional data. The newly defined WO index effectively measures the shape variation of curves and hence serves as a detector for shape outliers; additionally, MSBD provides a center-outward ranking result and works as a detector for magnitude outliers. Using the two measures, the functional boxplot of the trajectory reveals center-outward patterns and potential outliers using the raw curves, whereas the MSBD-WO plot illustrates such patterns and outliers in a space spanned by MSBD and WO. The proposed methods are validated on hurricane path data and migration trace data recorded from two types of birds.
AI Key Findings
Get AI-generated insights about this paper's methodology, results, significance, and more — seven facets brought into focus.
Impact
Paper Details
Authors
PDF Preview
Key Terms
Citation Network
Current paper (gray), citations (green), references (blue)
Display is limited for performance on very large graphs.
Discussion 0