Transformer-based Multivariate Time Series Anomaly Localization
Publication
Metrics
AI Quick Summary
This paper proposes a transformer-based model for unsupervised anomaly localization in multivariate time series data, enhancing detection through a new metric called Space-Time Anomaly Score (STAS) and reducing false alarms with Statistical Feature Anomaly Score (SFAS). Experiments show superior performance compared to existing methods.
Paper Preview
Abstract
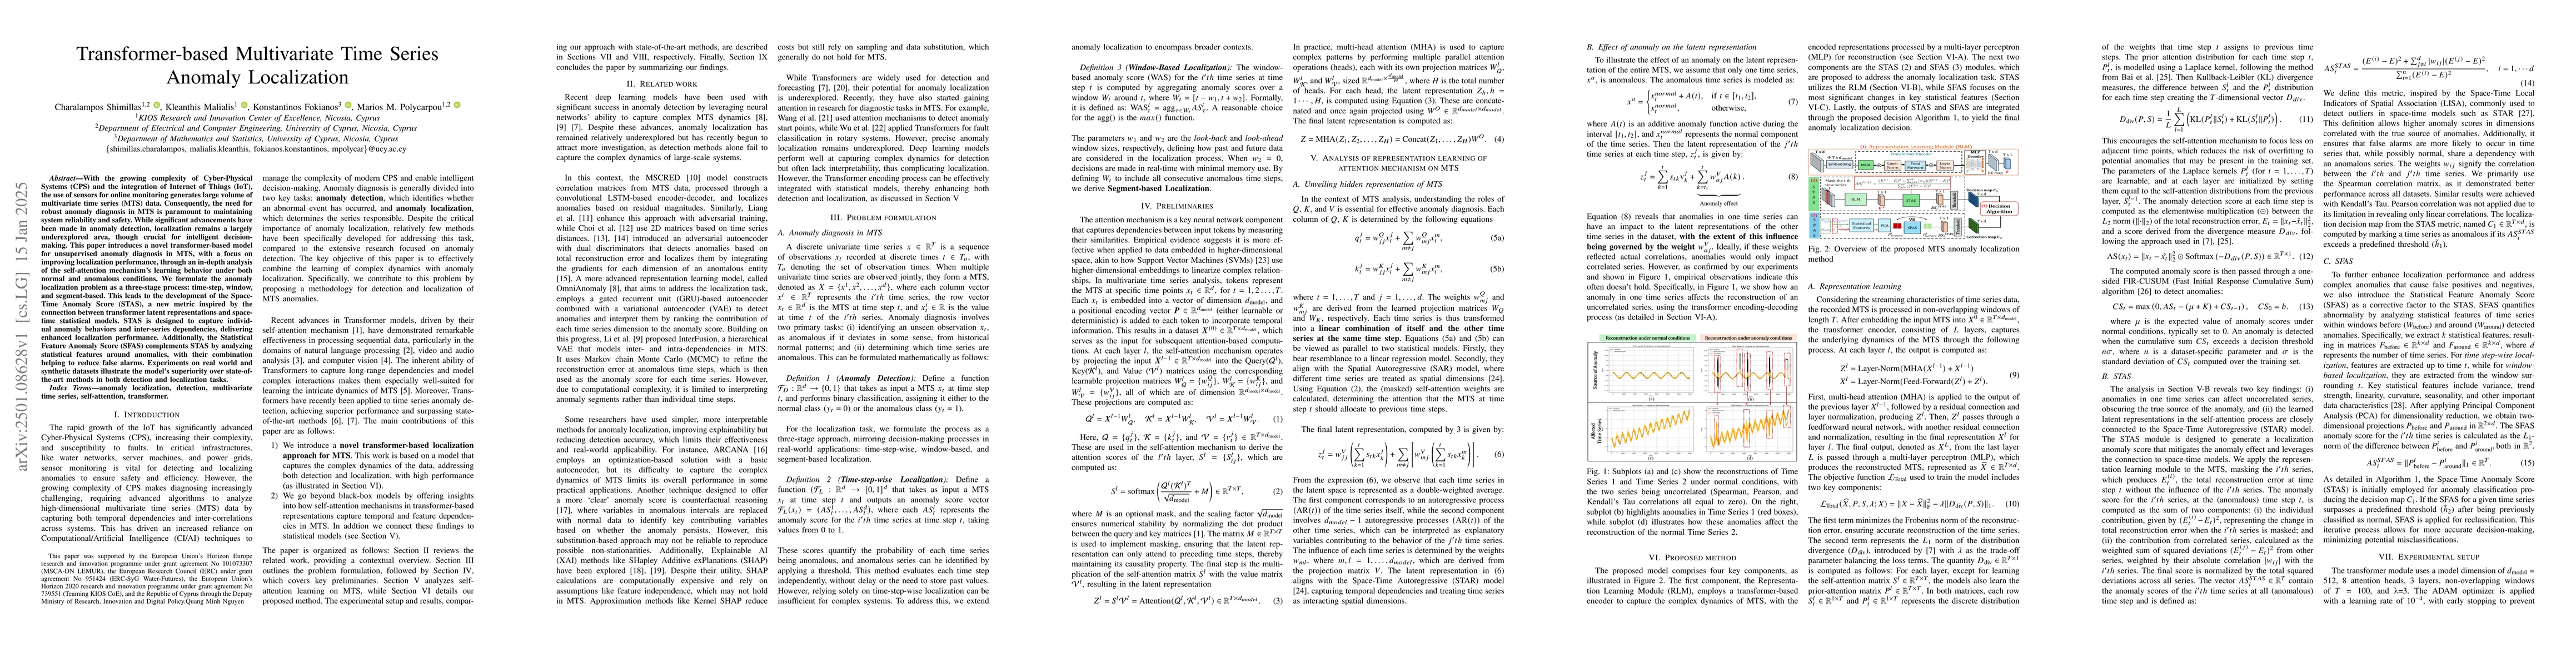
With the growing complexity of Cyber-Physical Systems (CPS) and the integration of Internet of Things (IoT), the use of sensors for online monitoring generates large volume of multivariate time series (MTS) data. Consequently, the need for robust anomaly diagnosis in MTS is paramount to maintaining system reliability and safety. While significant advancements have been made in anomaly detection, localization remains a largely underexplored area, though crucial for intelligent decision-making. This paper introduces a novel transformer-based model for unsupervised anomaly diagnosis in MTS, with a focus on improving localization performance, through an in-depth analysis of the self-attention mechanism's learning behavior under both normal and anomalous conditions. We formulate the anomaly localization problem as a three-stage process: time-step, window, and segment-based. This leads to the development of the Space-Time Anomaly Score (STAS), a new metric inspired by the connection between transformer latent representations and space-time statistical models. STAS is designed to capture individual anomaly behaviors and inter-series dependencies, delivering enhanced localization performance. Additionally, the Statistical Feature Anomaly Score (SFAS) complements STAS by analyzing statistical features around anomalies, with their combination helping to reduce false alarms. Experiments on real world and synthetic datasets illustrate the model's superiority over state-of-the-art methods in both detection and localization tasks.
AI Key Findings
Get AI-generated insights about this paper's methodology, results, significance, and more — seven facets brought into focus.
Authors
PDF Preview
Related Papers
No references found for this paper.
Discussion 0