TreatmentEstimatoR is an R Shiny dashboard designed to estimate treatment effects from observational health data without requiring programming skills. It offers multiple algorithms for estimating effects across different outcome types and includes tools for covariate selection and model performance metrics.
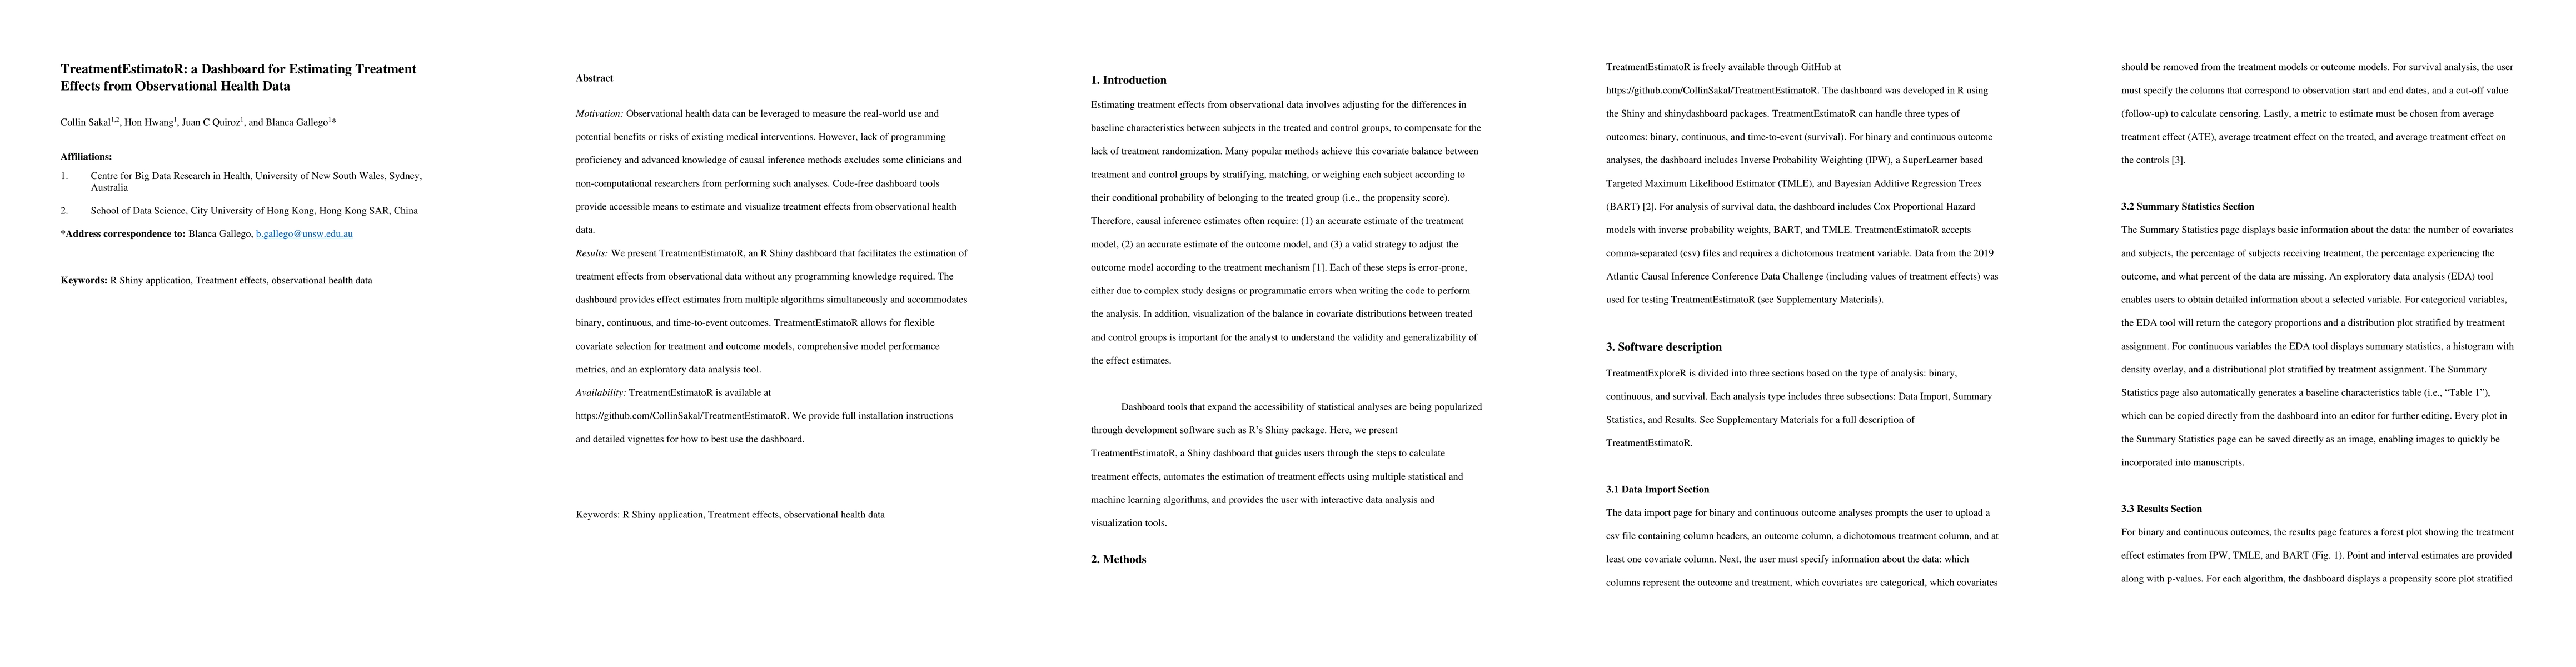
Observational health data can be leveraged to measure the real-world use and potential benefits or risks of existing medical interventions. However, lack of programming proficiency and advanced knowledge of causal inference methods excludes some clinicians and non-computational researchers from performing such analyses. Code-free dashboard tools provide accessible means to estimate and visualize treatment effects from observational health data. We present TreatmentEstimatoR, an R Shiny dashboard that facilitates the estimation of treatment effects from observational data without any programming knowledge required. The dashboard provides effect estimates from multiple algorithms simultaneously and accommodates binary, continuous, and time-to-event outcomes. TreatmentEstimatoR allows for flexible covariate selection for treatment and outcome models, comprehensive model performance metrics, and an exploratory data analysis tool. TreatmentEstimatoR is available at https://github.com/CollinSakal/TreatmentEstimatoR. We provide full installation instructions and detailed vignettes for how to best use the dashboard.
Get AI-generated insights about this paper's methodology, results, and significance.
Current paper (gray), citations (green), references (blue)
No similar papers found for this research.
No citations found for this paper.
Title | Authors | Year | Actions |
---|---|---|---|
Nonparametric Machine Learning and Efficient Computation with Bayesian Additive Regression Trees: The BART R Package
|
R. Sparapani, Charles Spanbauer, R. McCulloch
|
2021
|
View Paper |
Multivariate Adaptive Regression Splines
|
Bradley C. Boehmke, Brandon M. Greenwell
|
2019
|
View Paper |
ggplot2 - Elegant Graphics for Data Analysis (2nd Edition)
|
Virgilio Gómez-Rubio
|
2017
|
View Paper |
checkmate: Fast Argument Checks for Defensive R Programming
|
Michel Lang
|
2017
|
View Paper |
Advanced Forest Plot Using 'grid' Graphics
|
Max Gordon, T. Lumley
|
2016
|
View Paper |
ranger: A Fast Implementation of Random Forests for High Dimensional Data in C++ and R
|
Marvin N. Wright, A. Ziegler
|
2015
|
View Paper |
caret: Classification and Regression Training
|
M. Kuhn
|
2015
|
View Paper |
missForest: Nonparametric missing value imputation using random forest
|
D. Stekhoven
|
2015
|
View Paper |
Worth the weight: using inverse probability weighted Cox models in AIDS research.
|
Ashley L. Buchanan, M. Hudgens, S. Cole, B. Lau, A. Adimora
|
2014
|
View Paper |
tmle : An R Package for Targeted Maximum Likelihood Estimation
|
Susan Gruber, M. J. Laan
|
2012
|
View Paper |
MatchIt: Nonparametric Preprocessing for Parametric Causal Inference
|
Daniel E. Ho, K. Imai, Gary King, E. Stuart
|
2011
|
View Paper |
An Introduction to Propensity Score Methods for Reducing the Effects of Confounding in Observational Studies
|
P. Austin
|
2011
|
View Paper |
Dates and Times Made Easy with lubridate
|
Garrett Grolemund, H. Wickham
|
2011
|
View Paper |
pROC: an open-source package for R and S+ to analyze and compare ROC curves
|
X. Robin, N. Turck, A. Hainard, N. Tiberti, F. Lisacek, Jean-Charles Sanchez, Markus Müller
|
2011
|
View Paper |
Bayesian Nonparametric Modeling for Causal Inference
|
J. Hill
|
2011
|
View Paper |
Extended Model Formulas in R : Multiple Parts and Multiple Responses
|
A. Zeileis, Y. Croissant
|
2010
|
View Paper |
Regularization Paths for Generalized Linear Models via Coordinate Descent.
|
J. Friedman, T. Hastie, R. Tibshirani
|
2010
|
View Paper |
BART: Bayesian Additive Regression Trees
|
H. Chipman, E. George, R. McCulloch
|
2008
|
View Paper |
Lattice: Multivariate Data Visualization with R
|
Deepayan Sarkar
|
2008
|
View Paper |
kernlab - An S4 Package for Kernel Methods in R
|
Alexandros Karatzoglou, A. Smola, K. Hornik, A. Zeileis
|
2004
|
View Paper |
Modern Applied Statistics With S
|
Christina Gloeckner
|
2003
|
View Paper |
R package "corrplot": Visualization of a Correlation Matrix (Version 0.89)
|
2021
|
||
dplyr: A Grammar of Data Manipulation. R package version 1.0.5
|
2021
|
||
survminer: Drawing Survival Curves using 'ggplot2'. R package version 0.4.9
|
2021
|
||
SuperLearner: Super Learner Prediction
|
2021
|
||
Matrix: Sparse and Dense Matrix Classes and Methods. R package version 1.3-2
|
2021
|
||
MOSS: One-Step TMLE for Survival Analysis
|
2021
|
||
tidyr: Tidy Messy Data
|
2021
|
||
with contributions from Charles Dupont and many others
|
2021
|
||
shiny: Web Application Framework for R. R package version 1
|
2021
|
||
A Package for Survival Analysis in R_. R package version 3.2-10, <URL: https://CRAN.R-project.org/package=survival>
|
2021
|
||
cobalt: Covariate Balance Tables and Plots
|
2021
|
||
R Core Team
|
2021
|
||
_nlme: Linear and Nonlinear Mixed Effects Models_
|
2021
|
||
rms: Regression Modeling Strategies
|
2021
|
||
plotmo: Plot a Model's Residuals, Response, and Partial Dependence Plots
|
2020
|
||
TeachingDemos: Demonstrations for Teaching and Learning. R package version 2.12
|
2020
|
||
gam: Generalized Additive Models. R package version 1.20
|
2020
|
||
rJava: Low-Level R to Java Interface
|
2020
|
||
tableone: Create 'Table 1' to Describe Baseline Characteristics with or without Propensity Score Weights. R package version 0.12.0
|
2020
|
||
Derived from mda:mars by Trevor Hastie and Rob Tibshirani. Uses Alan Miller's Fortran utilities with Thomas Lumley's leaps wrapper
|
2020
|
||
R6: Encapsulated Classes with Reference Semantics
|
2020
|
||
foreach: Provides Foreach Looping Construct
|
2020
|
||
causalweight: Estimation Methods for Causal Inference Based on Inverse Probability Weighting
|
2020
|
||
shinyjs: Easily Improve the User Experience of Your Shiny Apps in Seconds
|
2020
|
||
ggpubr:
|
2020
|
||
magrittr: A Forward-Pipe Operator for R
|
2020
|
||
One-step TMLE for time-to-event outcomes
|
2019
|
||
survtmle: Compute Targeted Minimum Loss-Based Estimates in Right-Censored Survival Settings
|
2019
|
||
SparseM: Sparse Linear Algebra. R package version 1
|
2019
|
||
shinydashboard: Create Dashboards with 'Shiny'
|
2018
|
||
Bleich and see COPYRIGHTS file for the authors of the java libraries (2018)
|
2018
|
||
Targeted Maximum Likelihood Estimation for Causal Inference in Observational Studies
|
Megan S. Schuler, Sherri Rose
|
2017
|
View Paper |
R: A language and environment for statistical computing.
|
R. Team
|
2014
|
View Paper |
itertools: Iterator Tools
|
2014
|
||
nnls: The Lawson-Hanson algorithm for non-negative least squares (NNLS)
|
2012
|
||
The International Journal of Biostatistics Targeted Maximum Likelihood Learning
|
D. Rubin
|
2011
|
View Paper |
Classification and Regression by randomForest
|
Andy Liaw, M. Wiener
|
2007
|
View Paper |
Plotrix: a package in the red light district of R
|
2006
|
||
Modern Applied Statistics with S Fourth edition
|
W. Venables, B. Ripley
|
2002
|
View Paper |
Showing first page preview. Click "Open Full PDF" to view the complete paper.
Your comment contains inappropriate language and has been rejected.
Are you sure you want to remove this tag? This action cannot be undone.
Someone just favorited a paper!
Comments (0)