TreeFormers -- An Exploration of Vision Transformers for Deforestation Driver Classification
Publication
Metrics
AI Quick Summary
This paper investigates the use of vision transformers (ViTs) for classifying deforestation drivers in Indonesian forests using satellite imagery, achieving 72.9% test accuracy, and significantly outperforming baseline models. The study explores fine-tuning pre-trained ViTs, data augmentation, and longitudinal data embedding techniques.
Paper Preview
Abstract
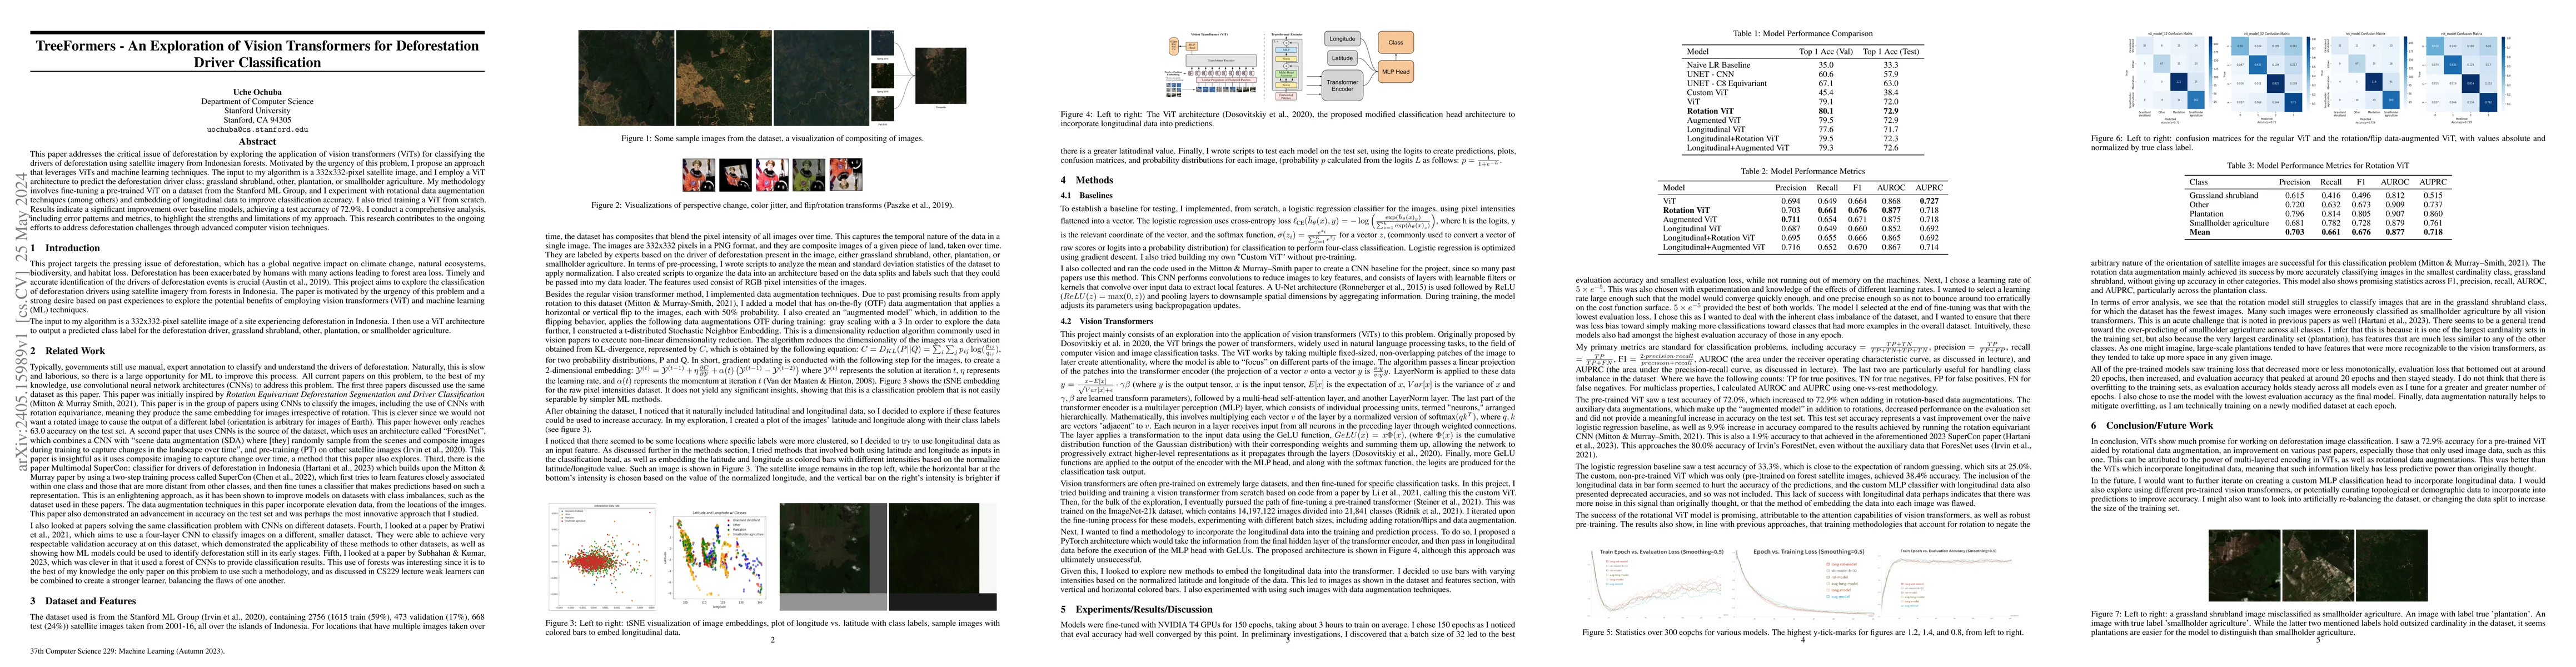
This paper addresses the critical issue of deforestation by exploring the application of vision transformers (ViTs) for classifying the drivers of deforestation using satellite imagery from Indonesian forests. Motivated by the urgency of this problem, I propose an approach that leverages ViTs and machine learning techniques. The input to my algorithm is a 332x332-pixel satellite image, and I employ a ViT architecture to predict the deforestation driver class; grassland shrubland, other, plantation, or smallholder agriculture. My methodology involves fine-tuning a pre-trained ViT on a dataset from the Stanford ML Group, and I experiment with rotational data augmentation techniques (among others) and embedding of longitudinal data to improve classification accuracy. I also tried training a ViT from scratch. Results indicate a significant improvement over baseline models, achieving a test accuracy of 72.9%. I conduct a comprehensive analysis, including error patterns and metrics, to highlight the strengths and limitations of my approach. This research contributes to the ongoing efforts to address deforestation challenges through advanced computer vision techniques.
AI Key Findings
Get AI-generated insights about this paper's methodology, results, significance, and more — seven facets brought into focus.
Impact
Paper Details
Authors
PDF Preview
Key Terms
Citation Network
Current paper (gray), citations (green), references (blue)
Display is limited for performance on very large graphs.
Discussion 0