Triadic Temporal Exponential Random Graph Models (TTERGM)
Publication
Metrics
AI Quick Summary
The paper proposes triadic temporal exponential random graph models (TTERGM) to better capture triadic relationships and small world characteristics in social networks. The TTERGM incorporates social learning theories and achieves improved prediction accuracy compared to existing methods.
Paper Preview
Abstract
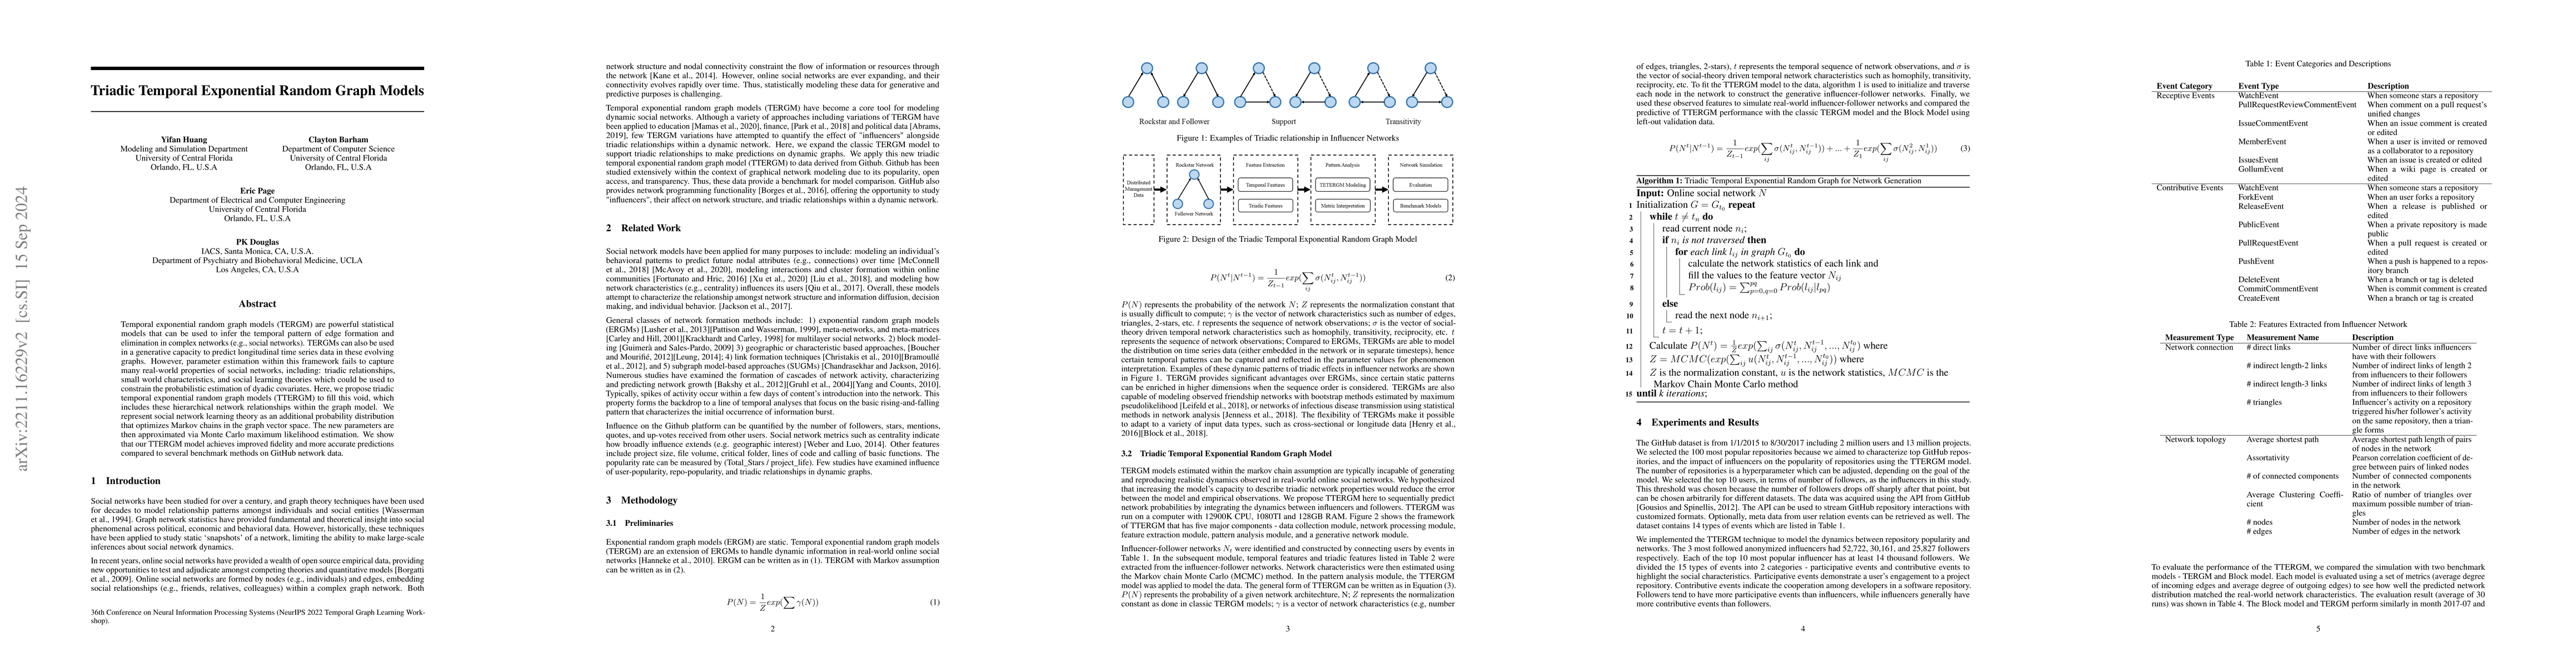
Temporal exponential random graph models (TERGM) are powerful statistical models that can be used to infer the temporal pattern of edge formation and elimination in complex networks (e.g., social networks). TERGMs can also be used in a generative capacity to predict longitudinal time series data in these evolving graphs. However, parameter estimation within this framework fails to capture many real-world properties of social networks, including: triadic relationships, small world characteristics, and social learning theories which could be used to constrain the probabilistic estimation of dyadic covariates. Here, we propose triadic temporal exponential random graph models (TTERGM) to fill this void, which includes these hierarchical network relationships within the graph model. We represent social network learning theory as an additional probability distribution that optimizes Markov chains in the graph vector space. The new parameters are then approximated via Monte Carlo maximum likelihood estimation. We show that our TTERGM model achieves improved fidelity and more accurate predictions compared to several benchmark methods on GitHub network data.
AI Key Findings
Get AI-generated insights about this paper's methodology, results, significance, and more — seven facets brought into focus.
Impact
Paper Details
Authors
PDF Preview
Key Terms
Citation Network
Current paper (gray), citations (green), references (blue)
Display is limited for performance on very large graphs.
Discussion 0