Trustworthy Automated Driving through Qualitative Scene Understanding and Explanations
Publication
Metrics
AI Quick Summary
This paper introduces the Qualitative Explainable Graph (QXG) for automated driving, providing a real-time, incremental scene understanding model that interprets sensor data with qualitative constraints, enhancing both in-vehicle explanations and decision-making. The model elucidates the rationale behind vehicle actions, benefiting passengers, vulnerable road users, and post-behavior analysis.
Paper Preview
Abstract
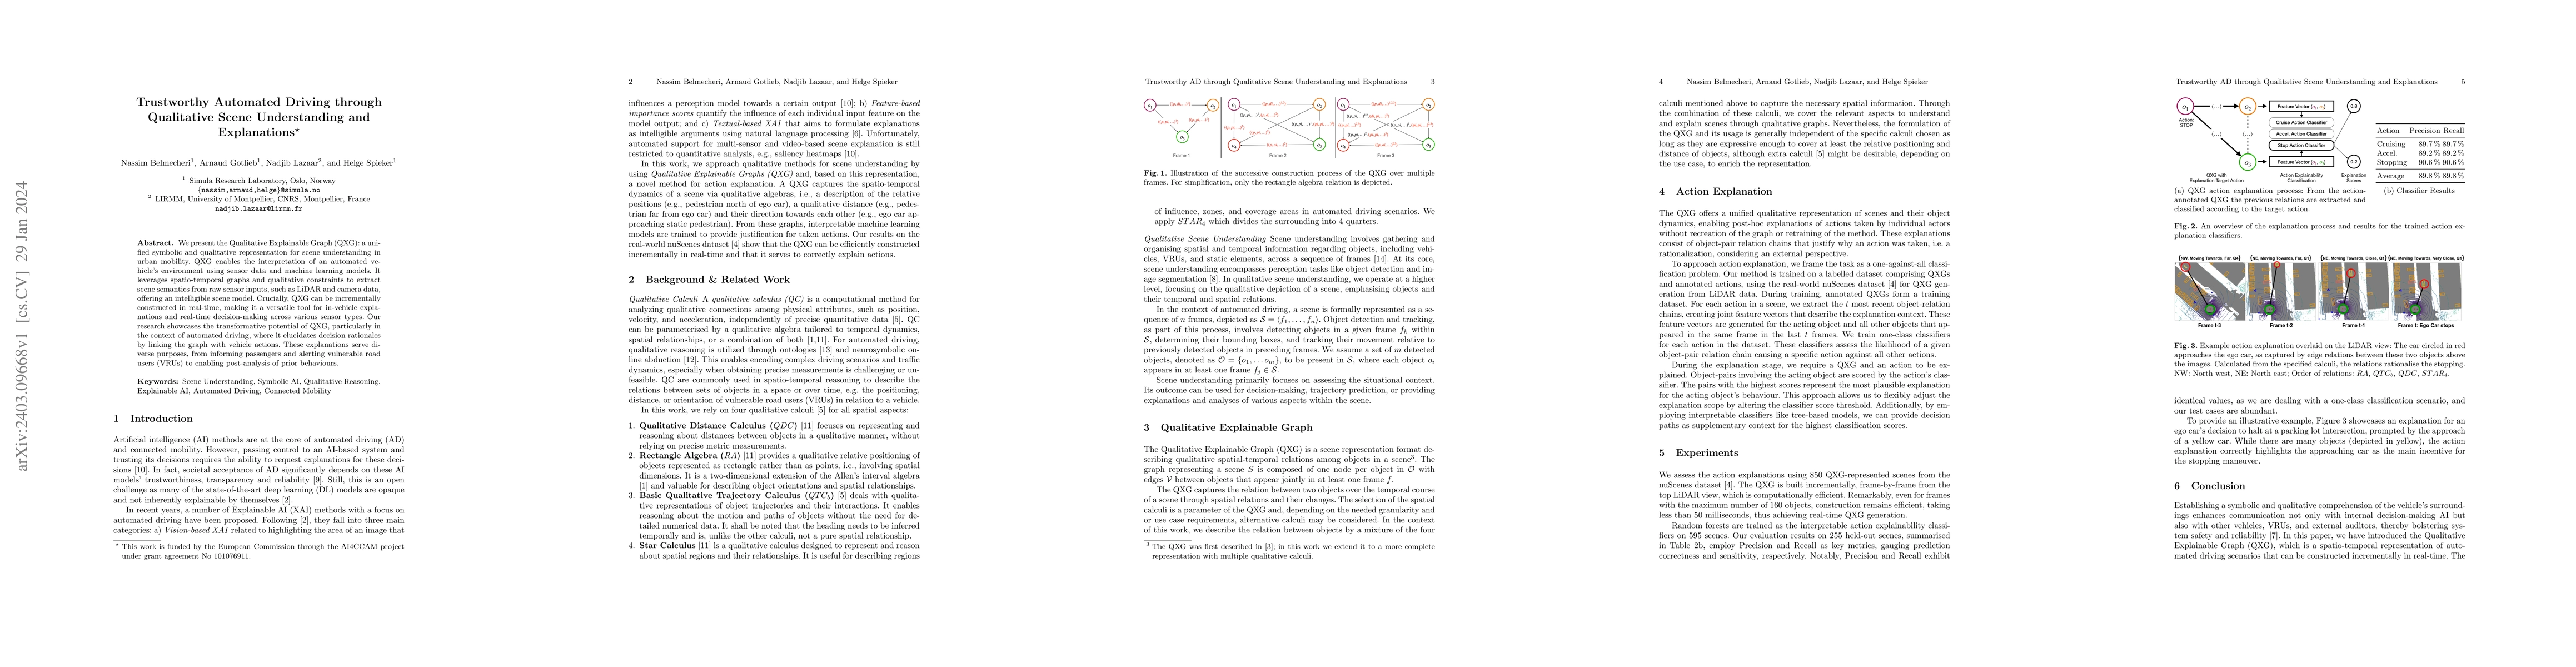
We present the Qualitative Explainable Graph (QXG): a unified symbolic and qualitative representation for scene understanding in urban mobility. QXG enables the interpretation of an automated vehicle's environment using sensor data and machine learning models. It leverages spatio-temporal graphs and qualitative constraints to extract scene semantics from raw sensor inputs, such as LiDAR and camera data, offering an intelligible scene model. Crucially, QXG can be incrementally constructed in real-time, making it a versatile tool for in-vehicle explanations and real-time decision-making across various sensor types. Our research showcases the transformative potential of QXG, particularly in the context of automated driving, where it elucidates decision rationales by linking the graph with vehicle actions. These explanations serve diverse purposes, from informing passengers and alerting vulnerable road users (VRUs) to enabling post-analysis of prior behaviours.
AI Key Findings
Get AI-generated insights about this paper's methodology, results, significance, and more — seven facets brought into focus.
Impact
Paper Details
Authors
PDF Preview
Key Terms
Citation Network
Current paper (gray), citations (green), references (blue)
Display is limited for performance on very large graphs.
Discussion 0