ArxivLens

Quick Summary:

This paper investigates how aspect ratio biases recall of position encodings in bar charts, finding that viewers overestimate wide bars and underestimate tall bars due to a mental bias towards prototypical square shapes. Experiments confirm that aspect ratio influences this bias, and it extends to memory-based reproductions, suggesting broader implications for other visualization types.

DOI: 10.1109/TVCG.2020.3030422
arXiv Id: 2009.06773
Date Published: 2021-08-20
Date Updated: 2021-08-20

Categories:

Key Terms (TF-IDF):

bars (0.331)
aspect (0.291)
bar (0.278)
bias (0.262)
biased (0.204)
values (0.189)
ratio (0.179)
prone (0.134)
similar (0.134)
resulted (0.132)
views (0.130)
influenced (0.128)
displays (0.127)
frequently (0.121)
biases (0.121)
reproduced (0.119)
discrepancy (0.119)
designs (0.119)
encoding (0.119)
sequential (0.117)
License: http://arxiv.org/licenses/nonexclusive-distrib/1.0/

Summary:

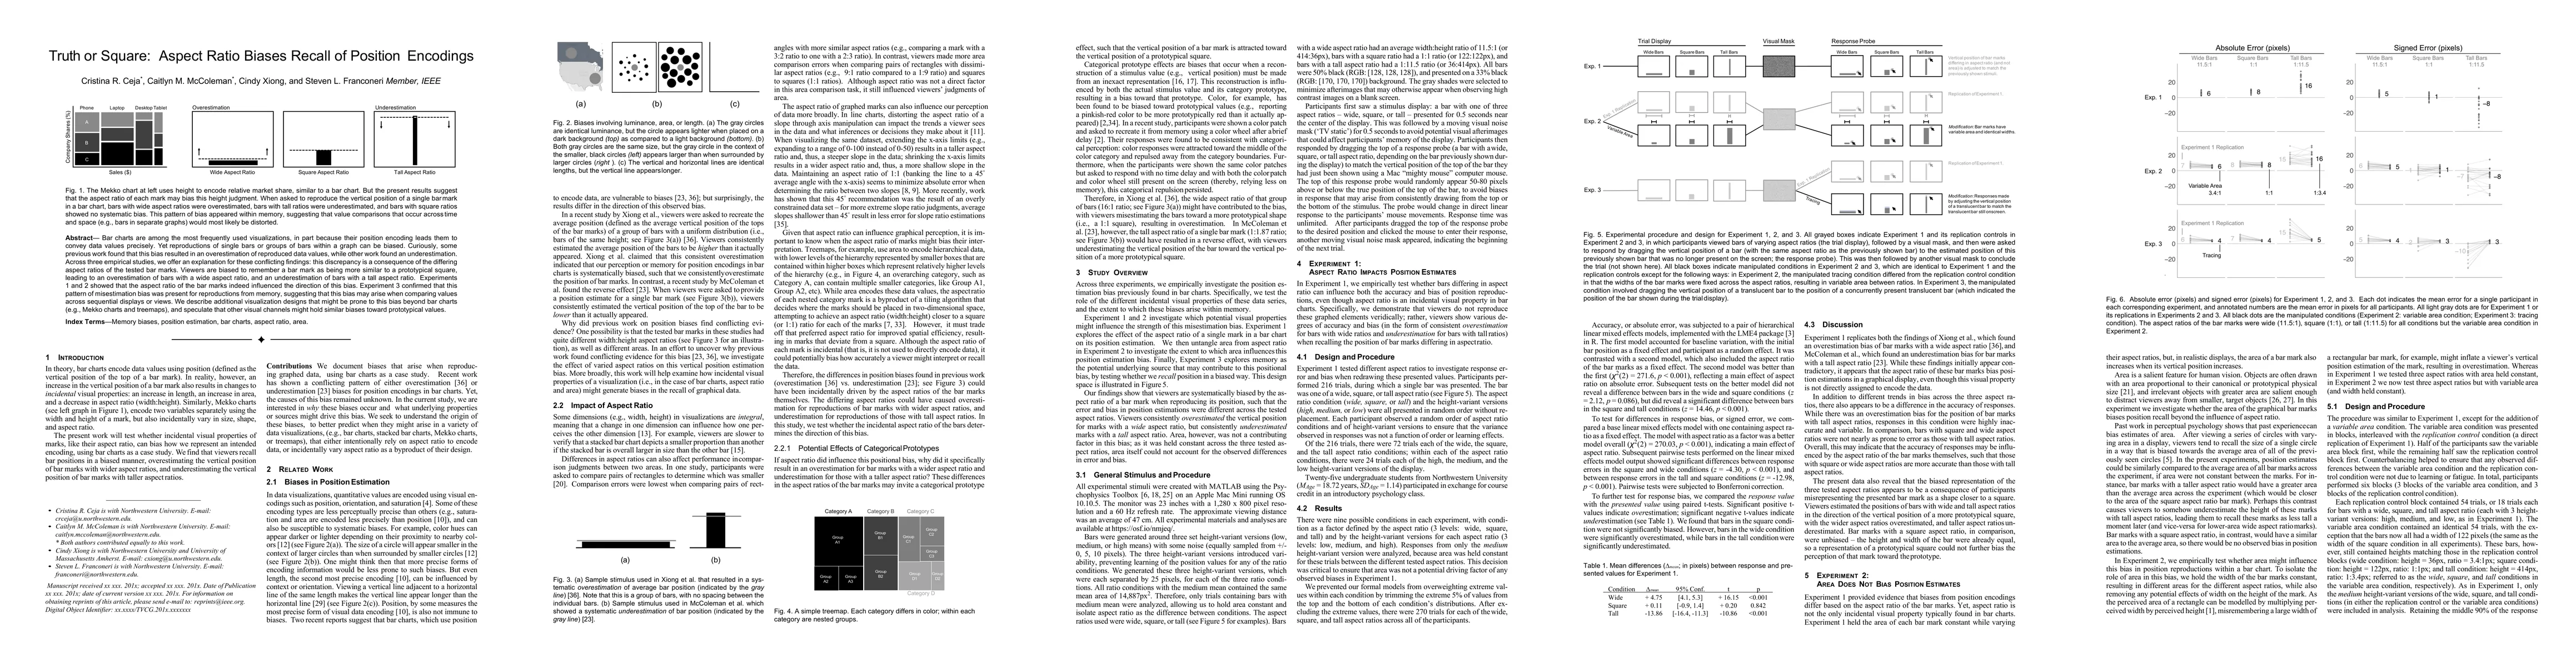
Bar charts are among the most frequently used visualizations, in part because their position encoding leads them to convey data values precisely. Yet reproductions of single bars or groups of bars within a graph can be biased. Curiously, some previous work found that this bias resulted in an overestimation of reproduced data values, while other work found an underestimation. Across three empirical studies, we offer an explanation for these conflicting findings: this discrepancy is a consequence of the differing aspect ratios of the tested bar marks. Viewers are biased to remember a bar mark as being more similar to a prototypical square, leading to an overestimation of bars with a wide aspect ratio, and an underestimation of bars with a tall aspect ratio. Experiments 1 and 2 showed that the aspect ratio of the bar marks indeed influenced the direction of this bias. Experiment 3 confirmed that this pattern of misestimation bias was present for reproductions from memory, suggesting that this bias may arise when comparing values across sequential displays or views. We describe additional visualization designs that might be prone to this bias beyond bar charts (e.g., Mekko charts and treemaps), and speculate that other visual channels might hold similar biases toward prototypical values.

Citation & Reference Network Visualization

This graph shows how this paper is connected to other research. The current paper is shown in dark gray, papers that cite it are in green, and papers it references are in blue. You can:

Current Paper
Papers citing this work (Citations)
Papers cited by this work (References)

• Hover over any node to see the paper title

• Click a node to view that paper's details

• Drag nodes to rearrange the graph

• Use the zoom controls (bottom right) to zoom in/out

Citations and References

Title Authors Year Actions
Towards softerware: Enabling personalization of interactive data representations for users with disabilities
Frank Elavsky, Marita Vindedal, Ted Gies, Patrick Carrington, Dominik Moritz, Øystein Moseng
2025
View Paper
Gridlines Mitigate Sine Illusion in Line Charts
Clayton Knittel, Jane Awuah, Steven Franconeri, Cindy Xiong Bearfield
2024
View Paper
Same Data, Diverging Perspectives: The Power of Visualizations to Elicit Competing Interpretations
Cindy Xiong Bearfield, Lisanne Van Weelden, Adam Waytz, Steven Franconeri
2024
View Paper
The Impact of Elicitation and Contrasting Narratives on Engagement, Recall and Attitude Change With News Articles Containing Data Visualization
Milad Rogha, Subham Sah, Alireza Karduni, Douglas Markant, Wenwen Dou
2024
View Paper
How Do Viewers Synthesize Conflicting Information from Data Visualizations?
Prateek Mantri, Hariharan Subramonyam, Audrey L. Michal, Cindy Xiong
2022
View Paper
Misinformed by Visualization: What Do We Learn From Misinformative Visualizations?
Leo Yu-Ho Lo, Ayush Gupta, Kento Shigyo, Aoyu Wu, E. Bertini, Huamin Qu
2022
View Paper
The Science of Visual Data Communication: What Works
S. Franconeri, Lace M. K. Padilla, P. Shah, Jeffrey M. Zacks, J. Hullman
2021
View Paper
A Review and Collation of Graphical Perception Knowledge for Visualization Recommendation
Zehua Zeng, L. Battle
2021
View Paper
Rethinking the Ranks of Visual Channels
Caitlyn M. McColeman, Fumeng Yang, S. Franconeri, Timothy F. Brady
2021
View Paper
Estimating Bar Graph Averages: Overcoming Within-the-Bar Bias
H. Kang, Jeayeong Ji, Yeji Yun, K. Han
2021
View Paper
No mark is an island: Precision and category repulsion biases in data reproductions
Caitlyn M. McColeman, Lane Harrison, Mi Feng, S. Franconeri
2020
View Paper
Studying Parallel Coordinates Under Varying Aspect Ratios
Leon Meka, Mirjam Kronsteiner, Johanna Schmidt
2025
View Paper
Are We There Yet? A Systematic Review of Visual Perception Knowledge for Visualization Recommendation Systems
Zehua Zeng, L. Battle
2022
View Paper

Similar Papers

NARAIM: Native Aspect Ratio Autoregressive Image Models

Daniel Gallo Fernández, Janusz Partyka, Efstratios Gavves, Samuele Papa, Phillip Lippe, Robert van der Klis, Rǎzvan-Andrei Matişan

Published: 2024-10-13

LieRE: Generalizing Rotary Position Encodings

Sophie Ostmeier, Brian Axelrod, Michael E. Moseley, Akshay Chaudhari, Curtis Langlotz

Published: 2024-06-18

Comments (0)

This website uses cookies to ensure you get the best experience. Learn more