Tumor Connectomics: Mapping the intra-tumoral complex interaction network
Publication
Metrics
AI Quick Summary
This research introduces Tumor Connectomics Framework (TCF) to model complex interactions within tumors using breast cancer patients' DCE-MRI scans. TCF effectively predicts treatment response, with degree centrality as the most significant predictor, offering improved visualization and interpretability of tumor changes.
Paper Preview
Abstract
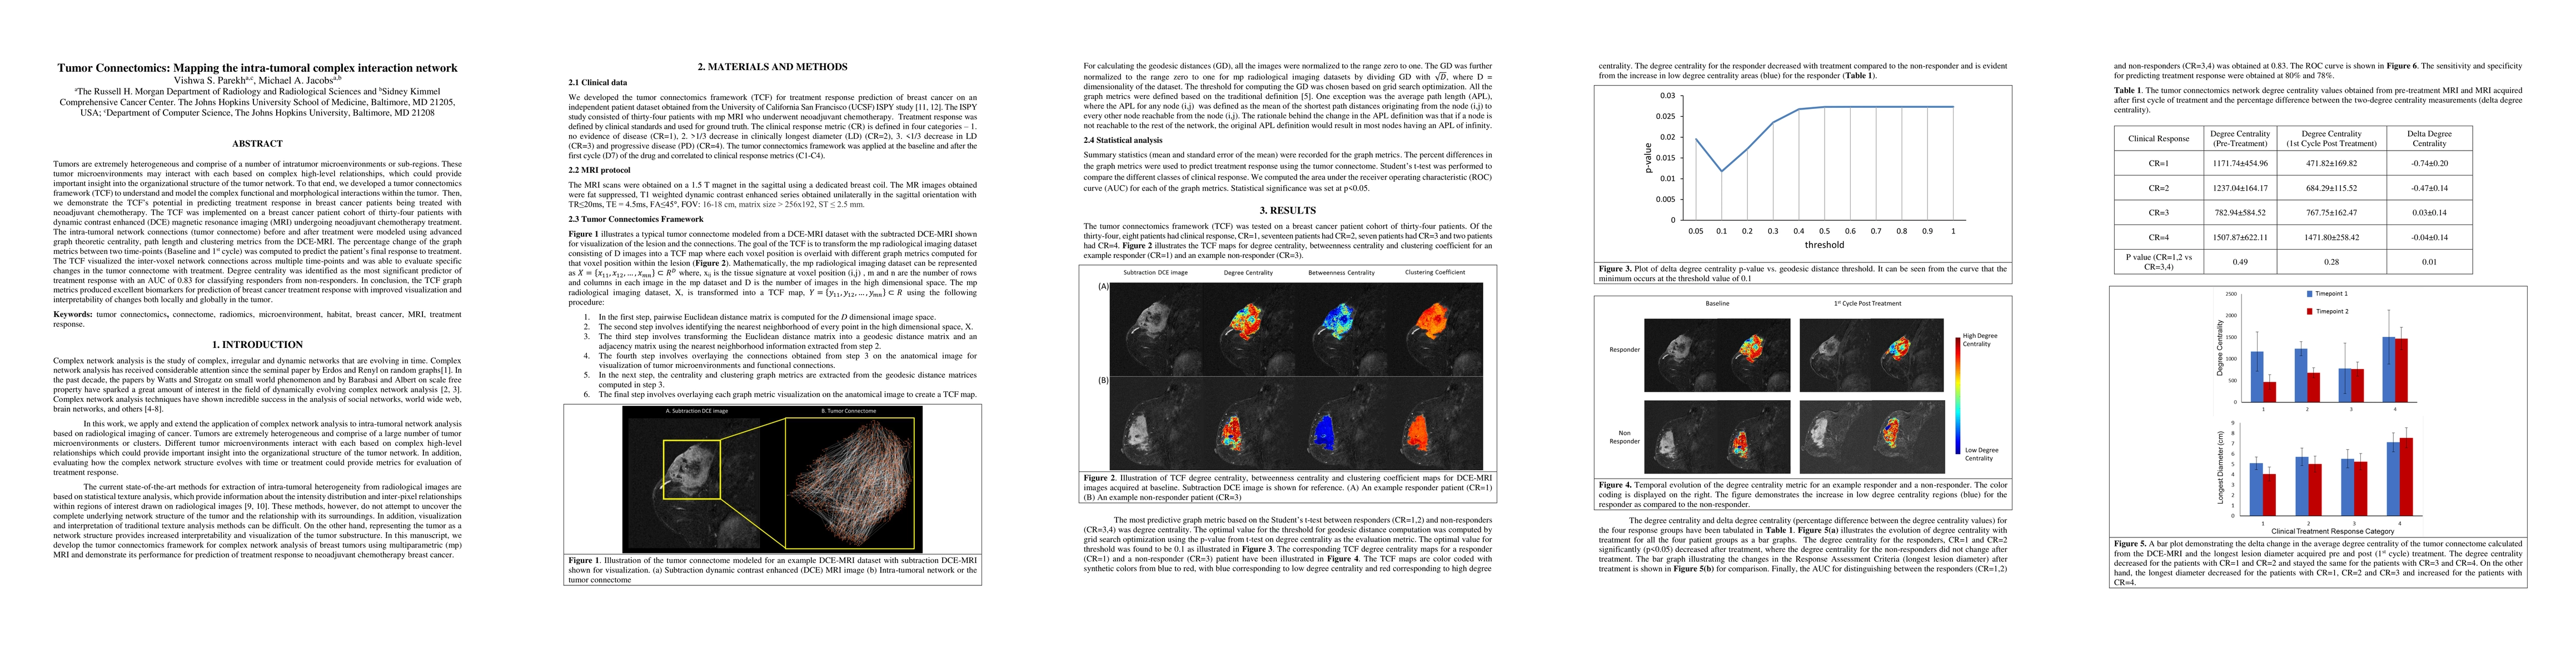
Tumors are extremely heterogeneous and comprise of a number of intratumor microenvironments or sub-regions. These tumor microenvironments may interact with eac based on complex high-level relationships, which could provide important insight into the organizational structure of the tumor network. To that end, we developed a tumor connectomics framework (TCF) to understand and model the complex functional and morphological interactions within the tumor. Then, we demonstrate the TCF's potential in predicting treatment response in breast cancer patients being treated with neoadjuvant chemotherapy. The TCF was implemented on a breast cancer patient cohort of thirty-four patients with dynamic contrast enhanced (DCE) magnetic resonance imaging (MRI) undergoing neodjuvant chemotherapy treatment. The intra-tumor network connections (tumor connectome) before and after treatment were modeled using advanced graph theoretic centrality, path length and clustering metrics from the DCE-MRI. The percentage change of the graph metrics between two time-points (Baseline and 1st cycle) was computed to predict the patient's final response to treatment. The TCF visualized the inter-voxel network connections across multiple time-points and was able to evaluate specific changes in the tumor connectome with treatment. Degree centrality was identified as the most significant predictor of treatment response with an AUC of 0.83 for classifying responders from non-responders. In conclusion, the TCF graph metrics produced excellent biomarkers for prediction of breast cancer treatment response with improved visualization and interpretability of changes both locally and globally in the tumor.
AI Key Findings
Get AI-generated insights about this paper's methodology, results, significance, and more — seven facets brought into focus.
Impact
Paper Details
PDF Preview
Key Terms
Citation Network
Current paper (gray), citations (green), references (blue)
Display is limited for performance on very large graphs.
Discussion 0