Two General Methods for Population Pharmacokinetic Modeling: Non-Parametric Adaptive Grid and Non-Parametric Bayesian
Publication
Metrics
AI Quick Summary
Two non-parametric methods for population pharmacokinetic modeling were developed and compared in a simulated study, showing excellent performance and flexibility in handling real-world challenges.
Paper Preview
Abstract
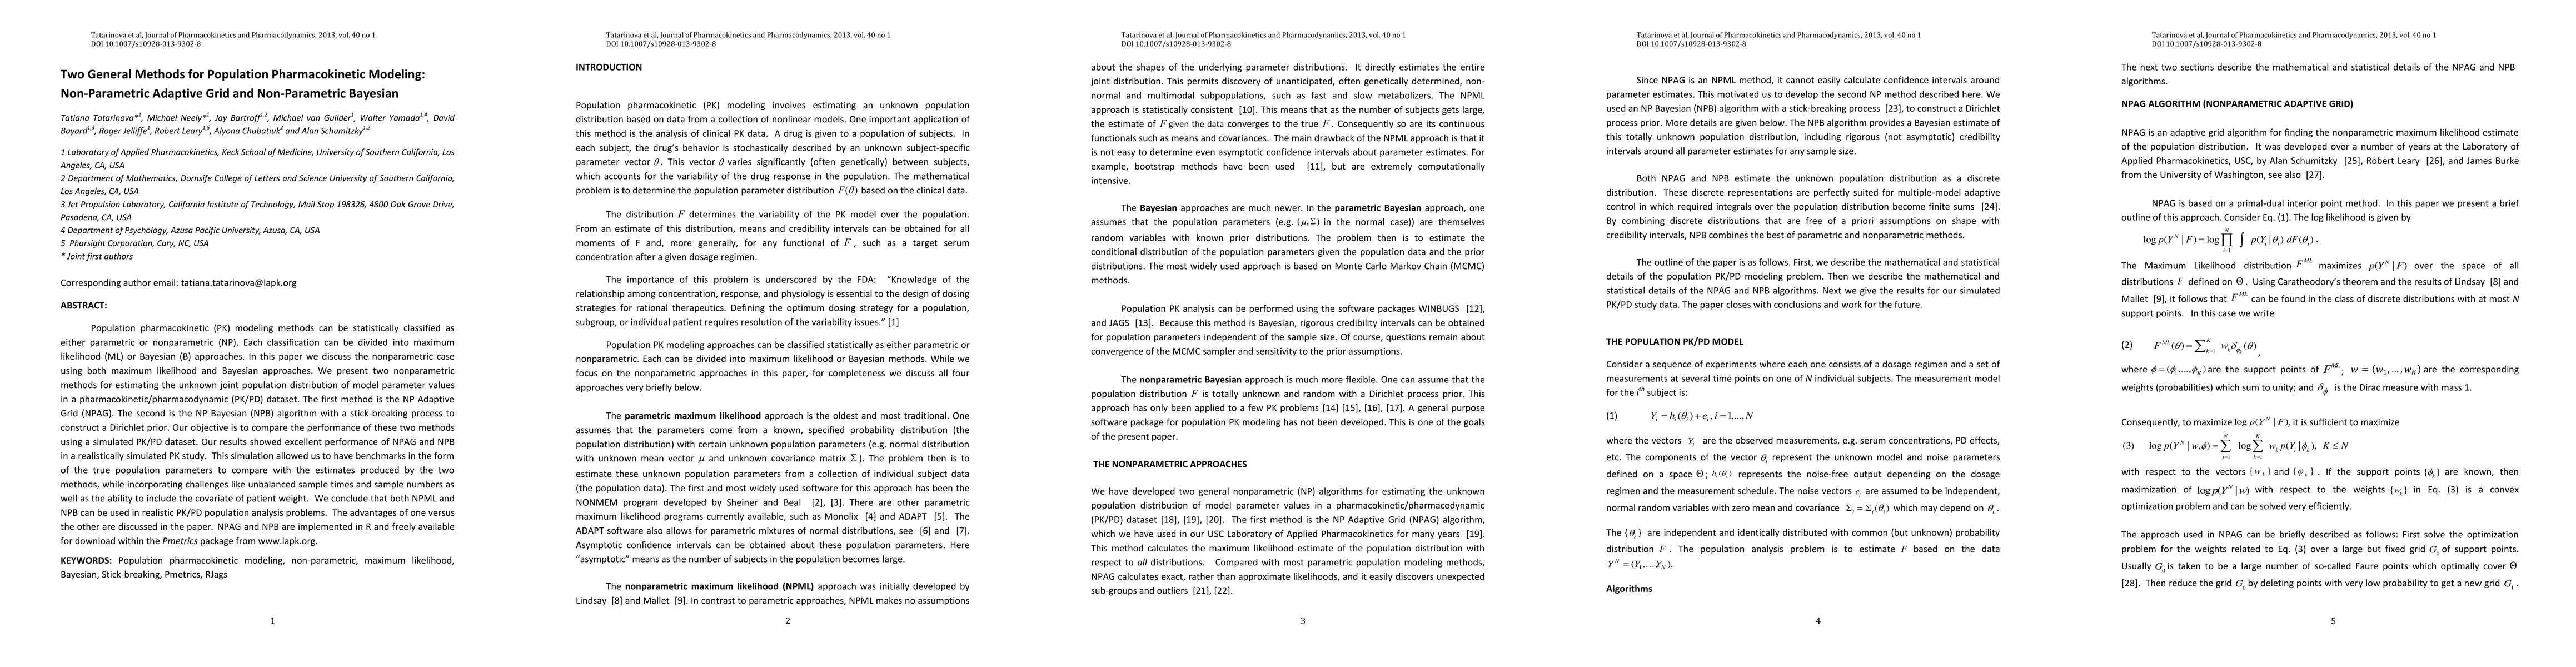
Population pharmacokinetic (PK) modeling methods can be statistically classified as either parametric or nonparametric (NP). Each classification can be divided into maximum likelihood (ML) or Bayesian (B) approaches. In this paper we discuss the nonparametric case using both maximum likelihood and Bayesian approaches. We present two nonparametric methods for estimating the unknown joint population distribution of model parameter values in a pharmacokinetic/pharmacodynamic (PK/PD) dataset. The first method is the NP Adaptive Grid (NPAG). The second is the NP Bayesian (NPB) algorithm with a stick-breaking process to construct a Dirichlet prior. Our objective is to compare the performance of these two methods using a simulated PK/PD dataset. Our results showed excellent performance of NPAG and NPB in a realistically simulated PK study. This simulation allowed us to have benchmarks in the form of the true population parameters to compare with the estimates produced by the two methods, while incorporating challenges like unbalanced sample times and sample numbers as well as the ability to include the covariate of patient weight. We conclude that both NPML and NPB can be used in realistic PK/PD population analysis problems. The advantages of one versus the other are discussed in the paper. NPAG and NPB are implemented in R and freely available for download within the Pmetrics package from www.lapk.org.
AI Key Findings
Get AI-generated insights about this paper's methodology, results, significance, and more — seven facets brought into focus.
Impact
Paper Details
PDF Preview
Key Terms
Citation Network
Current paper (gray), citations (green), references (blue)
Display is limited for performance on very large graphs.
Discussion 0