Publication
Metrics
AI Quick Summary
This paper reports the discovery and analysis of two strongly lensed Lyman-alpha Emitting Galaxies (LAEs) at redshifts z~5, revealing their intrinsic luminosities and star formation rates, and estimating the mass of young stars in each galaxy through gravitational lensing and SED modeling.
Paper Preview
Abstract
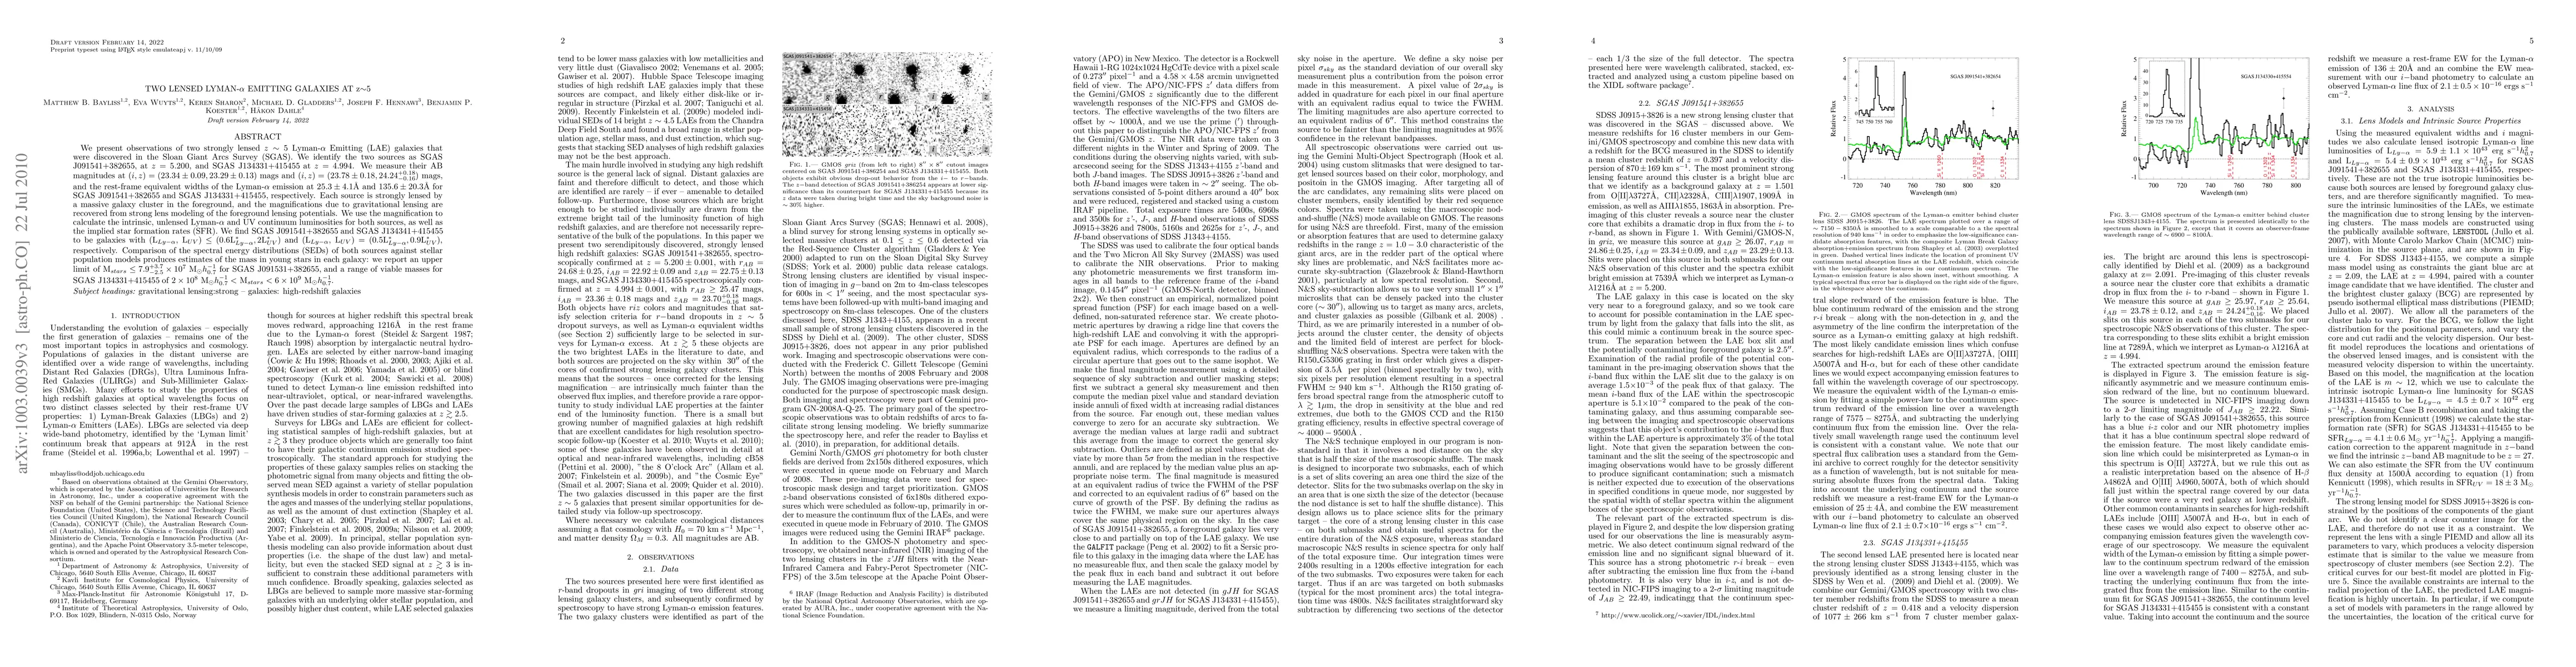
We present observations of two strongly lensed $z\sim5$ Lyman-$\alpha$ Emitting (LAE) galaxies that were discovered in the Sloan Giant Arcs Survey (SGAS). We identify the two sources as SGAS J091541+382655, at $z=5.200$, and SGAS J134331+415455 at $z=4.994$. We measure their AB magnitudes at $(i,z)=(23.34\pm0.09,23.29\pm0.13$) mags and $(i,z)=(23.78\pm0.18,24.24^{+0.18}_{-0.16}$) mags, and the rest-frame equivalent widths of the Lyman-$\alpha$ emission at $25.3\pm4.1$\AA~and $135.6\pm20.3$\AA~for SGAS J091541+382655 and SGAS J134331+415455, respectively. Each source is strongly lensed by a massive galaxy cluster in the foreground, and the magnifications due to gravitational lensing are recovered from strong lens modeling of the foreground lensing potentials. We use the magnification to calculate the intrinsic, unlensed Lyman-$\alpha$ and UV continuum luminosities for both sources, as well as the implied star formation rates (SFR). We find SGAS J091541+382655 and SGAS J134341+415455 to be galaxies with (L$_{Ly-\alpha}$, L$_{UV})\leq(0.6$L$_{Ly-\alpha}^{*}, 2$L$_{UV}^{*}$) and (L$_{Ly-\alpha}$, L$_{UV})=(0.5$L$_{Ly-\alpha}^{*}, 0.9$L$_{UV}^{*}$), respectively. Comparison of the spectral energy distributions (SEDs) of both sources against stellar population models produces estimates of the mass in young stars in each galaxy: we report an upper limit of M$_{stars} \leq 7.9^{+3.7}_{-2.5} \times 10^{7}$ M$_{\sun} h_{0.7}^{-1}$ for SGAS J091531+382655, and a range of viable masses for SGAS J134331+415455 of $2\times10^{8}$ M$_{\sun} h_{0.7}^{-1} <$ M$_{stars} < 6\times10^{9}$ M$_{\sun} h_{0.7}^{-1}$.
AI Key Findings
Get AI-generated insights about this paper's methodology, results, significance, and more — seven facets brought into focus.
Impact
Paper Details
PDF Preview
Key Terms
Citation Network
Current paper (gray), citations (green), references (blue)
Display is limited for performance on very large graphs.
Discussion 0