Summary
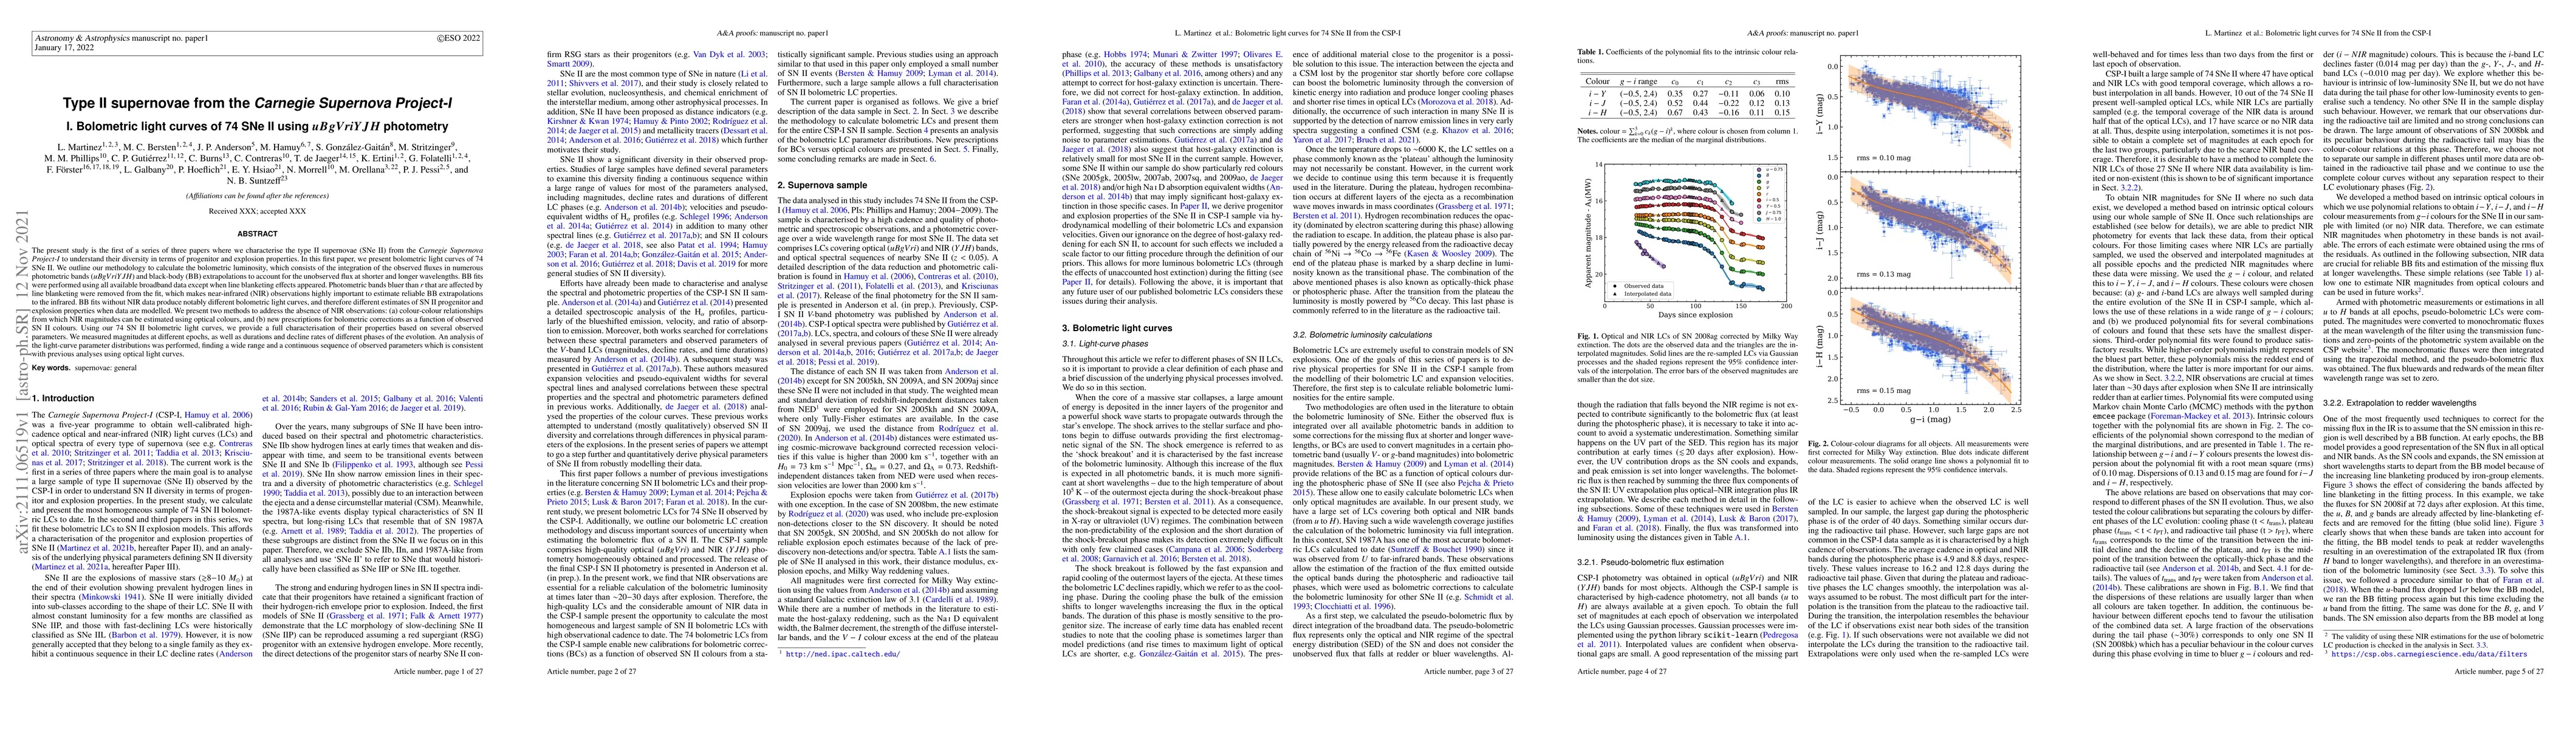
The present study is the first of a series of three papers where we characterise the type II supernovae (SNe~II) from the Carnegie Supernova Project-I to understand their diversity in terms of progenitor and explosion properties. In this first paper, we present bolometric light curves of 74 SNe~II. We outline our methodology to calculate the bolometric luminosity, which consists of the integration of the observed fluxes in numerous photometric bands ($uBgVriYJH$) and black-body (BB) extrapolations to account for the unobserved flux at shorter and longer wavelengths. BB fits were performed using all available broadband data except when line blanketing effects appeared. Photometric bands bluer than $r$ that are affected by line blanketing were removed from the fit, which makes near-infrared (NIR) observations highly important to estimate reliable BB extrapolations to the infrared. BB fits without NIR data produce notably different bolometric light curves, and therefore different estimates of SN~II progenitor and explosion properties when data are modelled. We present two methods to address the absence of NIR observations: (a) colour-colour relationships from which NIR magnitudes can be estimated using optical colours, and (b) new prescriptions for bolometric corrections as a function of observed SN~II colours. Using our 74 SN~II bolometric light curves, we provide a full characterisation of their properties based on several observed parameters. We measured magnitudes at different epochs, as well as durations and decline rates of different phases of the evolution. An analysis of the light-curve parameter distributions was performed, finding a wide range and a continuous sequence of observed parameters which is consistent with previous analyses using optical light curves.
AI Key Findings
Get AI-generated insights about this paper's methodology, results, and significance.
Paper Details
PDF Preview
Key Terms
Citation Network
Current paper (gray), citations (green), references (blue)
Display is limited for performance on very large graphs.
Similar Papers
Found 4 papersType II supernovae from the Carnegie Supernova Project-I. II. Physical parameter distributions from hydrodynamical modelling
P. Hoeflich, T. de Jaeger, L. Galbany et al.
Carnegie Supernova Project: kinky $i$-band light-curves of Type Ia supernovae
C. Ashall, P. Hoeflich, E. Baron et al.
| Title | Authors | Year | Actions |
|---|
Comments (0)