U-GAT: Multimodal Graph Attention Network for COVID-19 Outcome Prediction
Publication
Metrics
AI Quick Summary
The U-GAT model integrates multimodal data, including imaging and non-imaging information, to predict COVID-19 patient outcomes using a graph attention network. The results demonstrate superior performance compared to single modality and non-graph baselines, offering insights into patient relationships and decision-making processes.
Paper Preview
Abstract
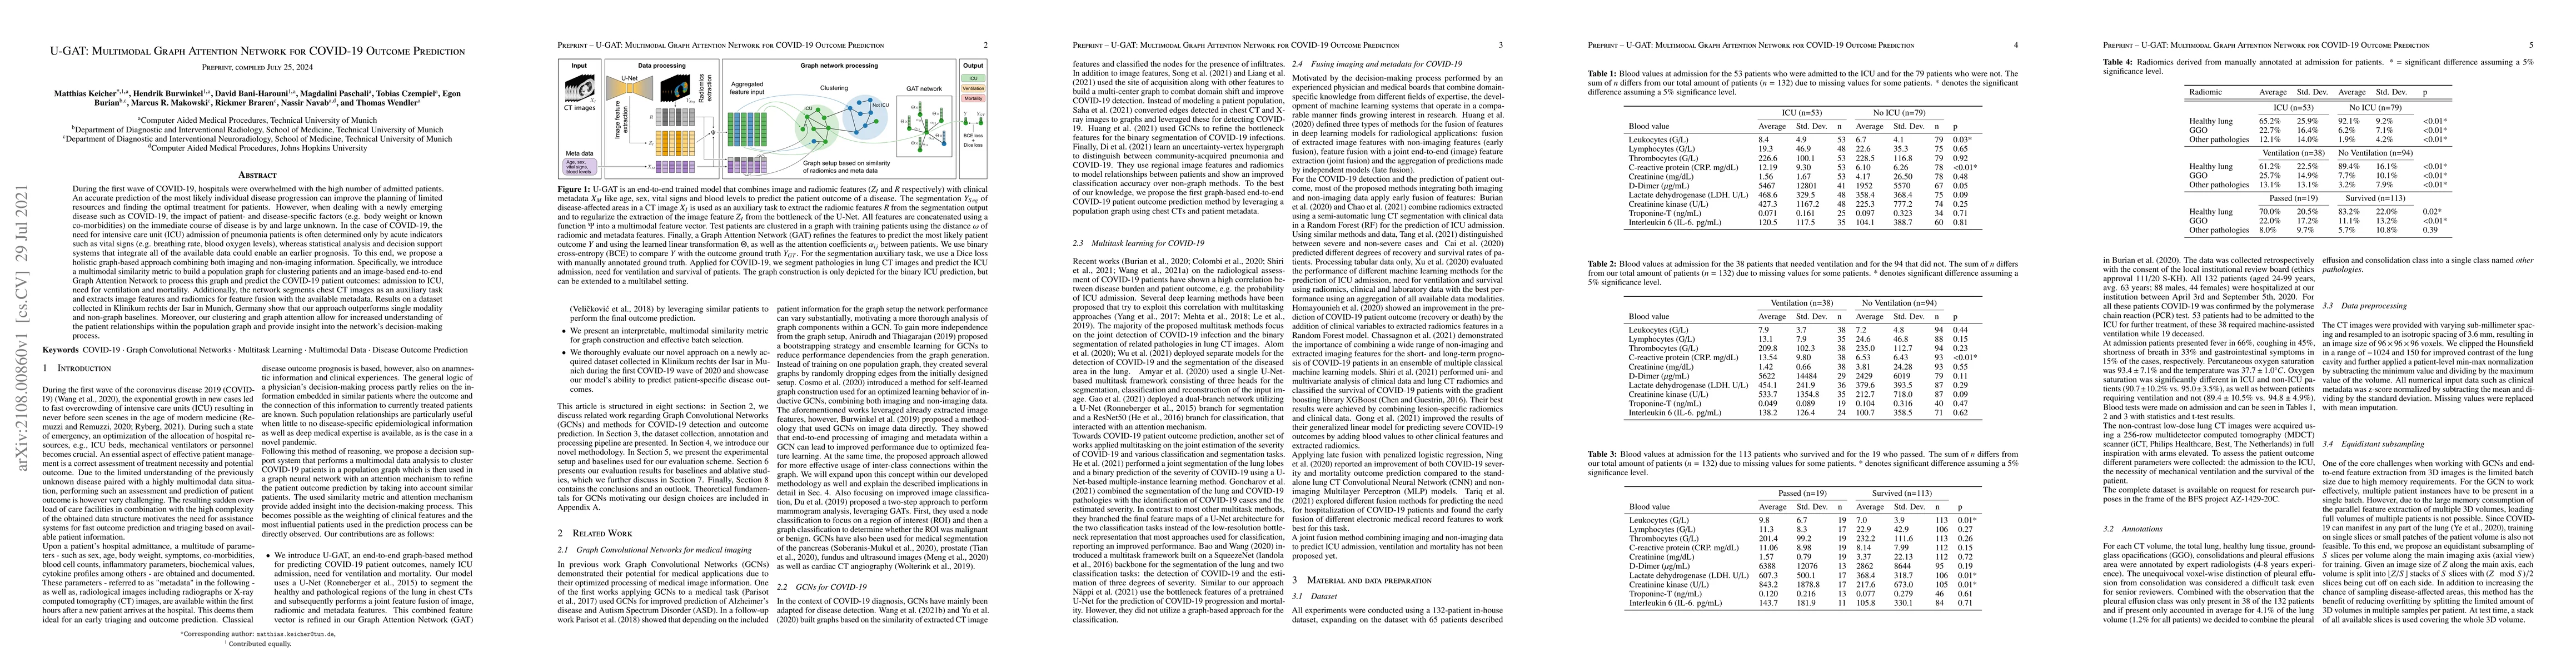
During the first wave of COVID-19, hospitals were overwhelmed with the high number of admitted patients. An accurate prediction of the most likely individual disease progression can improve the planning of limited resources and finding the optimal treatment for patients. However, when dealing with a newly emerging disease such as COVID-19, the impact of patient- and disease-specific factors (e.g. body weight or known co-morbidities) on the immediate course of disease is by and large unknown. In the case of COVID-19, the need for intensive care unit (ICU) admission of pneumonia patients is often determined only by acute indicators such as vital signs (e.g. breathing rate, blood oxygen levels), whereas statistical analysis and decision support systems that integrate all of the available data could enable an earlier prognosis. To this end, we propose a holistic graph-based approach combining both imaging and non-imaging information. Specifically, we introduce a multimodal similarity metric to build a population graph for clustering patients and an image-based end-to-end Graph Attention Network to process this graph and predict the COVID-19 patient outcomes: admission to ICU, need for ventilation and mortality. Additionally, the network segments chest CT images as an auxiliary task and extracts image features and radiomics for feature fusion with the available metadata. Results on a dataset collected in Klinikum rechts der Isar in Munich, Germany show that our approach outperforms single modality and non-graph baselines. Moreover, our clustering and graph attention allow for increased understanding of the patient relationships within the population graph and provide insight into the network's decision-making process.
AI Key Findings
Get AI-generated insights about this paper's methodology, results, significance, and more — seven facets brought into focus.
Impact
Paper Details
Authors
PDF Preview
Key Terms
Citation Network
Current paper (gray), citations (green), references (blue)
Display is limited for performance on very large graphs.
Discussion 0