UFLUX v2.0: A Process-Informed Machine Learning Framework for Efficient and Explainable Modelling of Terrestrial Carbon Uptake
Publication
Metrics
AI Quick Summary
UFLUX v2.0 introduces a machine learning framework that significantly improves Gross Primary Productivity (GPP) estimation by reducing biases between process-based models and eddy covariance measurements, achieving higher accuracy and more accurate spatial distribution compared to traditional models.
Paper Preview
Abstract
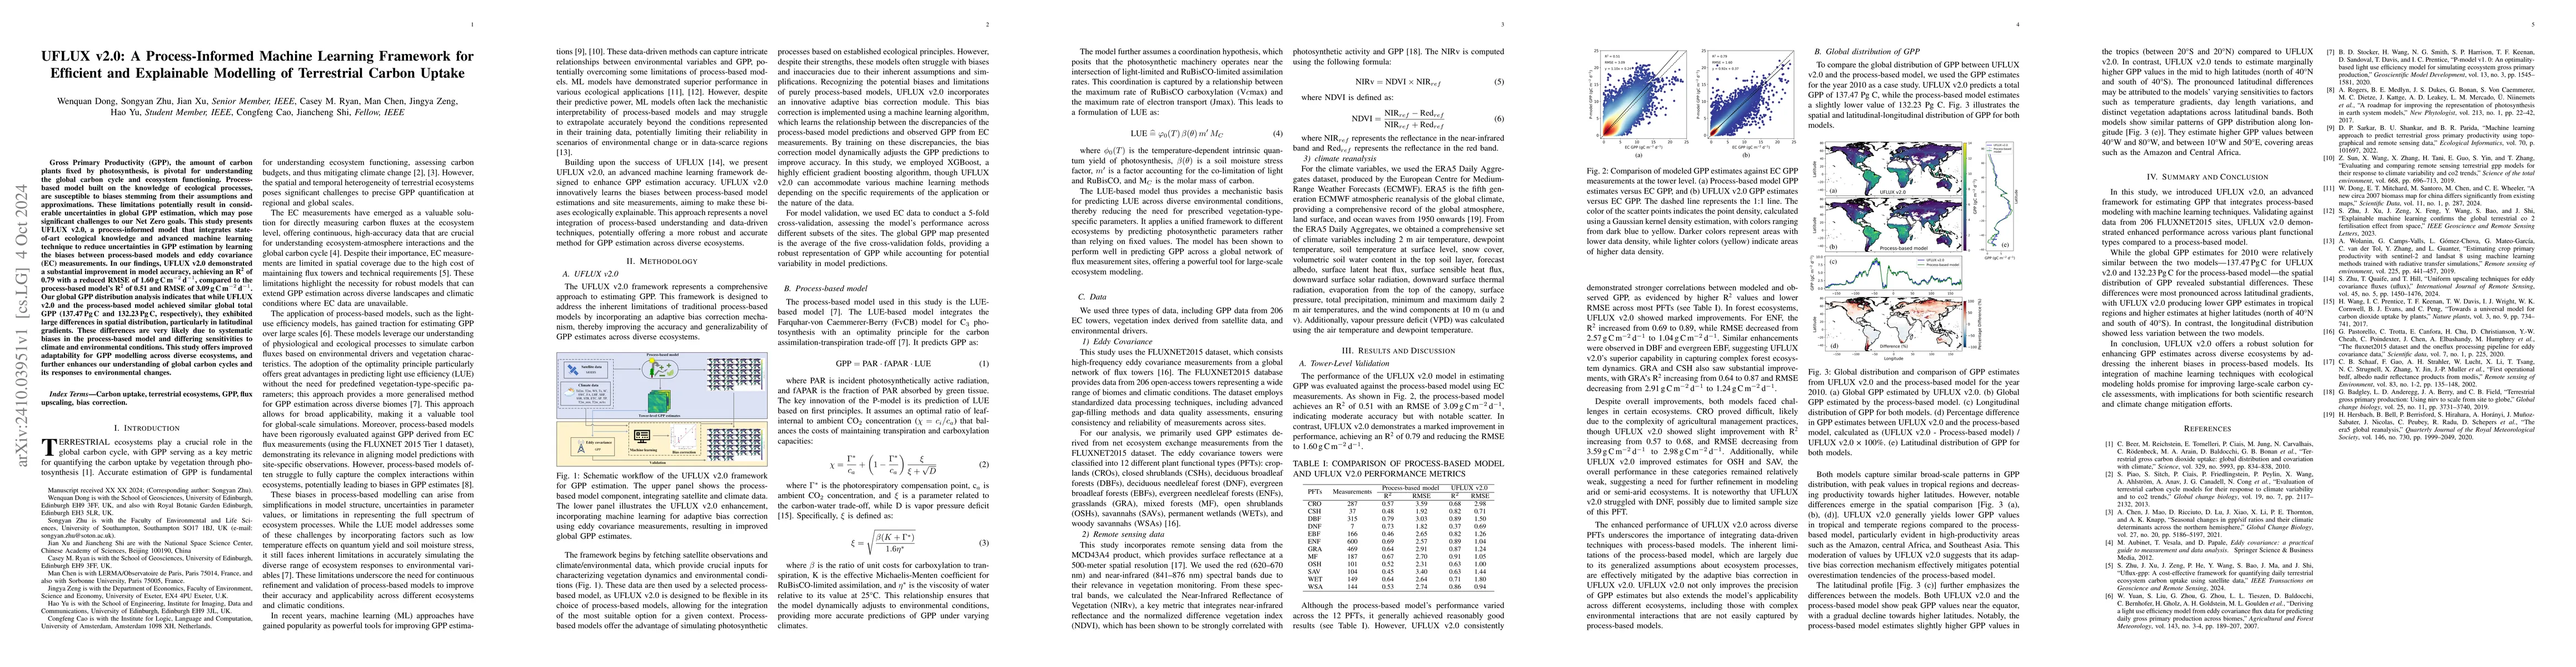
Gross Primary Productivity (GPP), the amount of carbon plants fixed by photosynthesis, is pivotal for understanding the global carbon cycle and ecosystem functioning. Process-based models built on the knowledge of ecological processes are susceptible to biases stemming from their assumptions and approximations. These limitations potentially result in considerable uncertainties in global GPP estimation, which may pose significant challenges to our Net Zero goals. This study presents UFLUX v2.0, a process-informed model that integrates state-of-art ecological knowledge and advanced machine learning techniques to reduce uncertainties in GPP estimation by learning the biases between process-based models and eddy covariance (EC) measurements. In our findings, UFLUX v2.0 demonstrated a substantial improvement in model accuracy, achieving an R^2 of 0.79 with a reduced RMSE of 1.60 g C m^-2 d^-1, compared to the process-based model's R^2 of 0.51 and RMSE of 3.09 g C m^-2 d^-1. Our global GPP distribution analysis indicates that while UFLUX v2.0 and the process-based model achieved similar global total GPP (137.47 Pg C and 132.23 Pg C, respectively), they exhibited large differences in spatial distribution, particularly in latitudinal gradients. These differences are very likely due to systematic biases in the process-based model and differing sensitivities to climate and environmental conditions. This study offers improved adaptability for GPP modelling across diverse ecosystems, and further enhances our understanding of global carbon cycles and its responses to environmental changes.
AI Key Findings
Get AI-generated insights about this paper's methodology, results, significance, and more — seven facets brought into focus.
Impact
Paper Details
Authors
PDF Preview
Citation Network
Current paper (gray), citations (green), references (blue)
Display is limited for performance on very large graphs.
Discussion 0