Understanding overfitting in random forest for probability estimation: a visualization and simulation study
Publication
Metrics
AI Quick Summary
This study investigates overfitting in random forests for probability estimation, using visualizations and simulations. It found that random forests often learn local peaks in probability, yielding near-perfect training performance but less so on test data, challenging the recommendation to use fully grown trees for probability estimation.
Paper Preview
Abstract
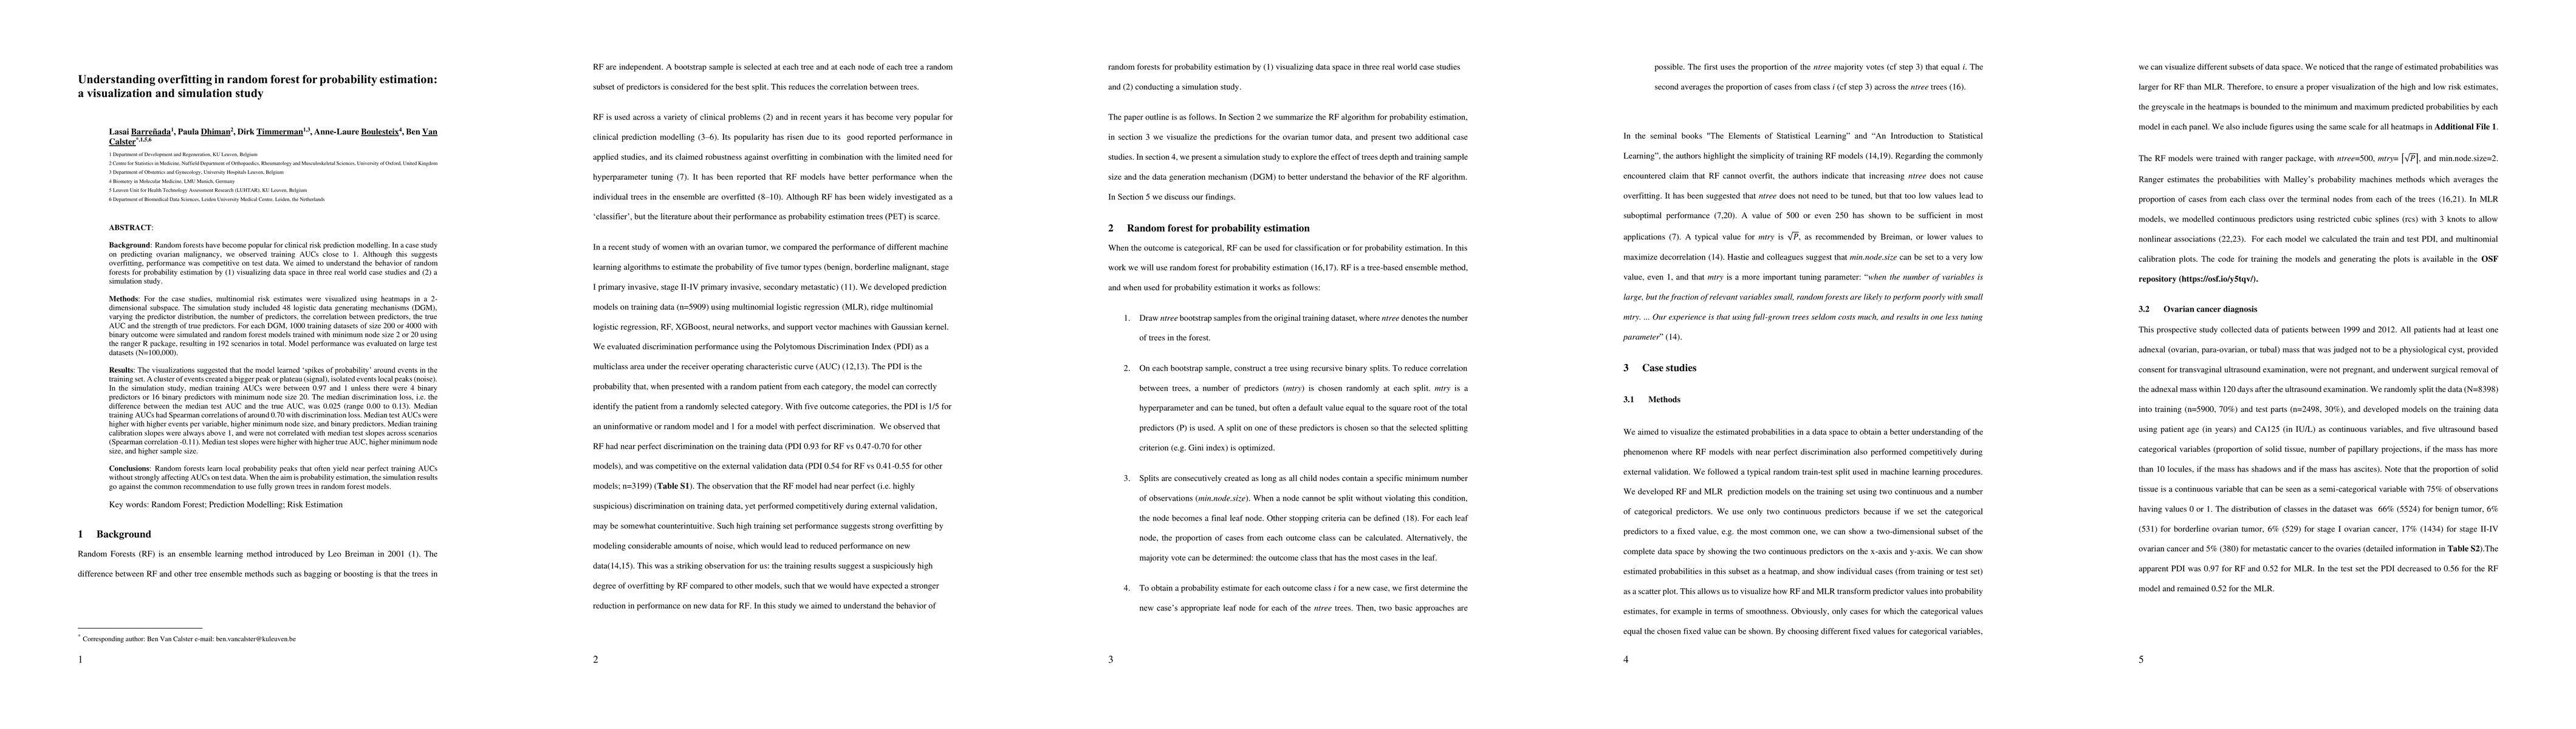
Random forests have become popular for clinical risk prediction modelling. In a case study on predicting ovarian malignancy, we observed training c-statistics close to 1. Although this suggests overfitting, performance was competitive on test data. We aimed to understand the behaviour of random forests by (1) visualizing data space in three real world case studies and (2) a simulation study. For the case studies, risk estimates were visualised using heatmaps in a 2-dimensional subspace. The simulation study included 48 logistic data generating mechanisms (DGM), varying the predictor distribution, the number of predictors, the correlation between predictors, the true c-statistic and the strength of true predictors. For each DGM, 1000 training datasets of size 200 or 4000 were simulated and RF models trained with minimum node size 2 or 20 using ranger package, resulting in 192 scenarios in total. The visualizations suggested that the model learned spikes of probability around events in the training set. A cluster of events created a bigger peak, isolated events local peaks. In the simulation study, median training c-statistics were between 0.97 and 1 unless there were 4 or 16 binary predictors with minimum node size 20. Median test c-statistics were higher with higher events per variable, higher minimum node size, and binary predictors. Median training slopes were always above 1, and were not correlated with median test slopes across scenarios (correlation -0.11). Median test slopes were higher with higher true c-statistic, higher minimum node size, and higher sample size. Random forests learn local probability peaks that often yield near perfect training c-statistics without strongly affecting c-statistics on test data. When the aim is probability estimation, the simulation results go against the common recommendation to use fully grown trees in random forest models.
AI Key Findings
Get AI-generated insights about this paper's methodology, results, significance, and more — seven facets brought into focus.
Impact
Paper Details
Authors
PDF Preview
Citation Network
Current paper (gray), citations (green), references (blue)
Display is limited for performance on very large graphs.
Discussion 0