Unlocking New Physics with Joint Power Spectrum and Voxel Intensity Distribution Forecasts in Line-Intensity Mapping
Publication
Metrics
AI Quick Summary
This paper explores how combining joint power spectrum and voxel intensity distribution forecasts enhances parameter estimation precision in line-intensity mapping surveys. Using an analytical model, the study demonstrates significant improvements in sensitivity to beyond-ΛCDM physics when analyzing both statistics together, compared to using either individually, thus unlocking new insights into fundamental physics.
Paper Preview
Abstract
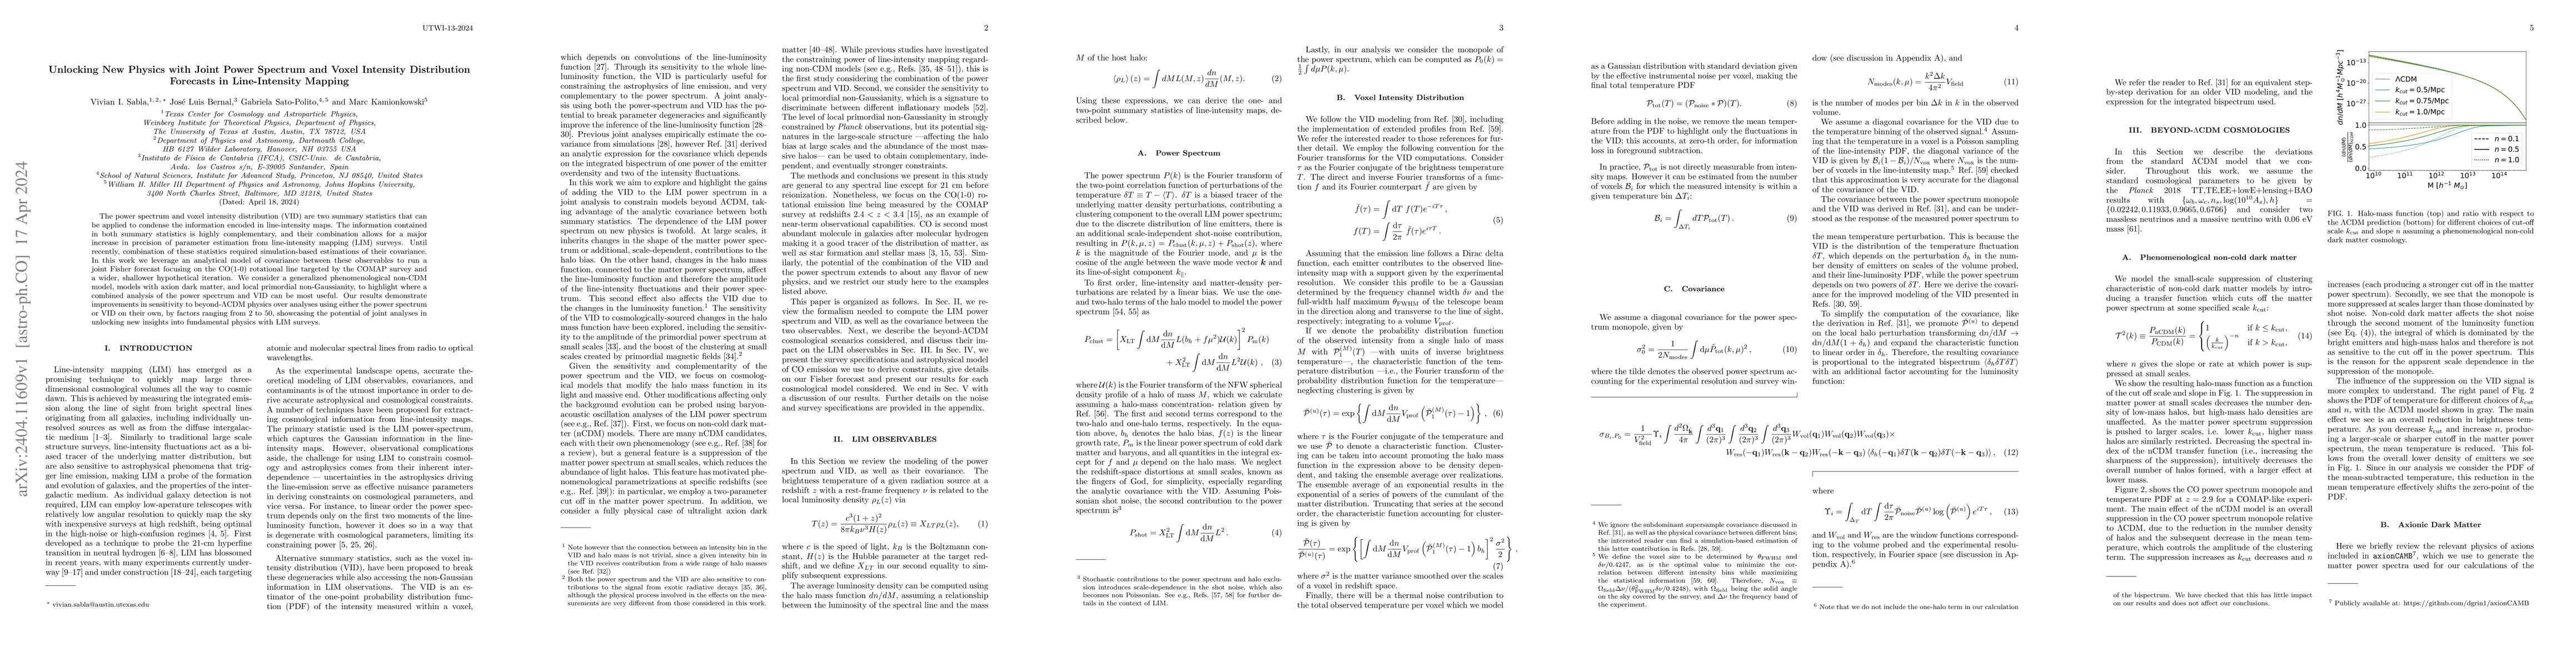
The power spectrum and voxel intensity distribution (VID) are two summary statistics that can be applied to condense the information encoded in line-intensity maps. The information contained in both summary statistics is highly complementary, and their combination allows for a major increase in precision of parameter estimation from line-intensity mapping (LIM) surveys. Until recently, combination of these statistics required simulation-based estimations of their covariance. In this work we leverage an analytical model of covariance between these observables to run a joint Fisher forecast focusing on the CO(1-0) rotational line targeted by the COMAP survey and a wider, shallower hypothetical iteration. We consider a generalized phenomenological non-CDM model, models with axion dark matter, and local primordial non-Gaussianity, to highlight where a combined analysis of the power spectrum and VID can be most useful. Our results demonstrate improvements in sensitivity to beyond-$\Lambda$CDM physics over analyses using either the power spectrum or VID on their own, by factors ranging from 2 to 50, showcasing the potential of joint analyses in unlocking new insights into fundamental physics with LIM surveys.
AI Key Findings
Get AI-generated insights about this paper's methodology, results, significance, and more — seven facets brought into focus.
Impact
Paper Details
Authors
PDF Preview
Key Terms
Citation Network
Current paper (gray), citations (green), references (blue)
Display is limited for performance on very large graphs.
Discussion 0