Unraveling the graph structure of tabular data through Bayesian and spectral analysis
Publication
Metrics
AI Quick Summary
This paper proposes a graph-based method for analyzing tabular data to uncover relationships among features using Bayesian and spectral analysis. The method maps data into a weighted directed graph and employs the Nested Stochastic Block Model and spectral embedding to identify feature classes and relationships, demonstrated through a socioeconomic survey in Brazil.
Paper Preview
Abstract
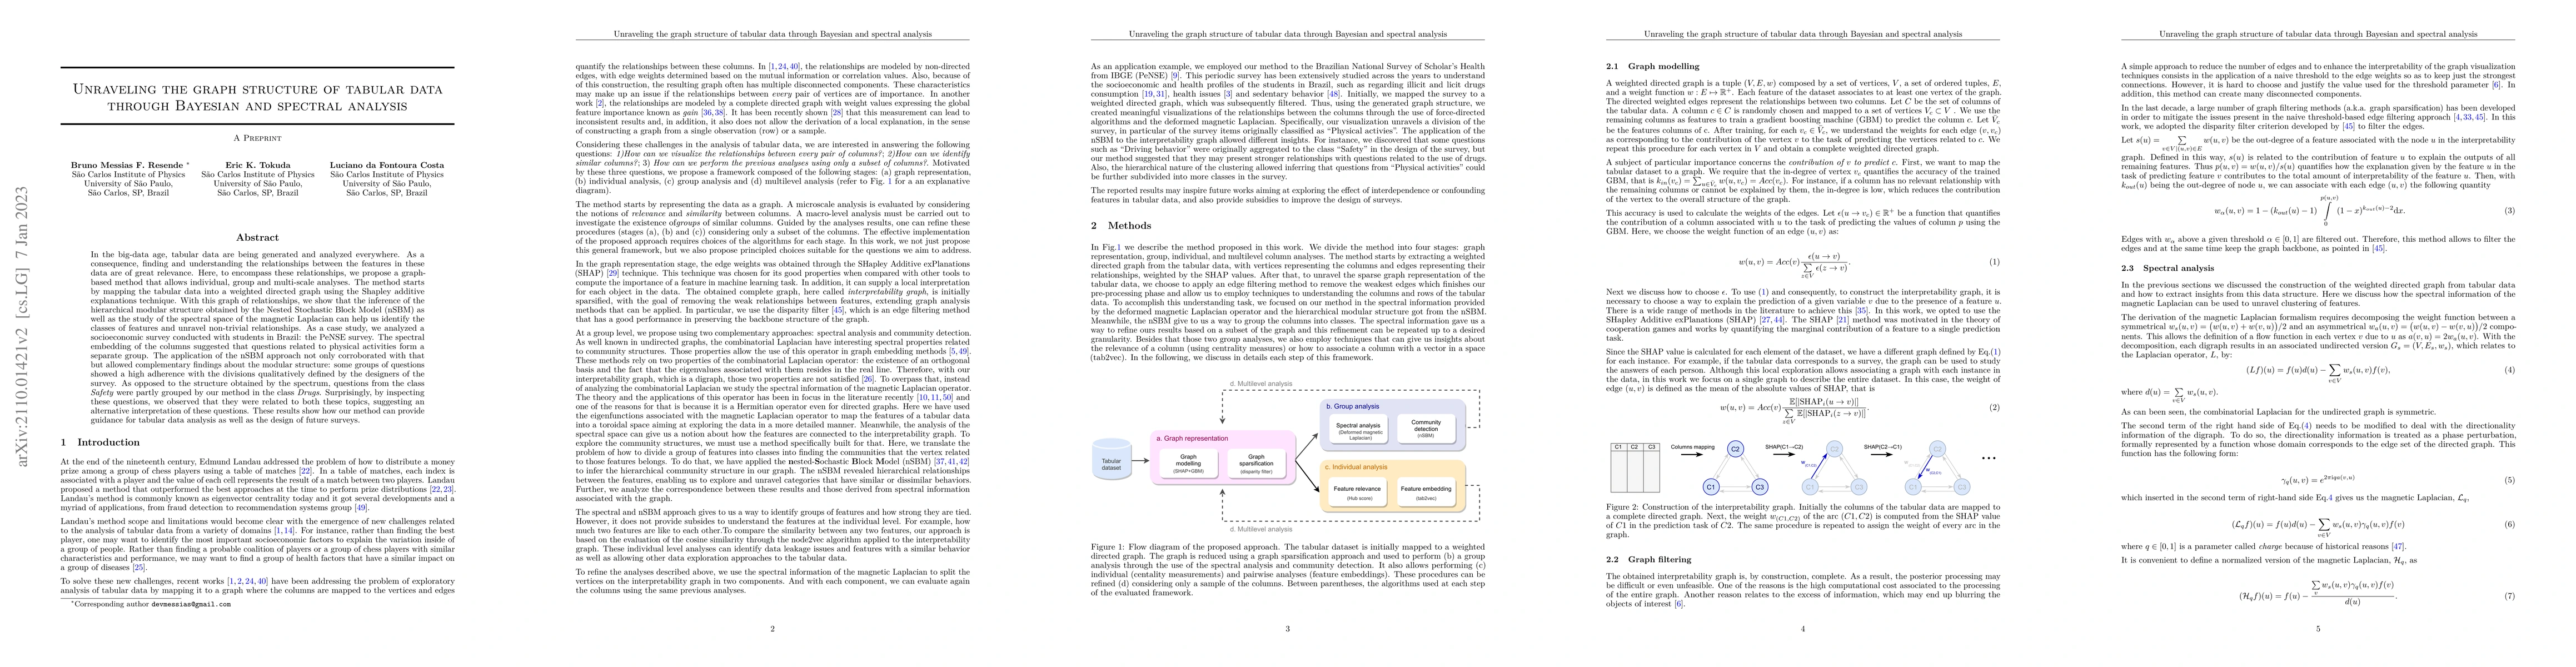
In the big-data age, tabular data are being generated and analyzed everywhere. As a consequence, finding and understanding the relationships between the features in these data are of great relevance. Here, to encompass these relationships, we propose a graph-based method that allows individual, group and multi-scale analyses. The method starts by mapping the tabular data into a weighted directed graph using the Shapley additive explanations technique. With this graph of relationships, we show that the inference of the hierarchical modular structure obtained by the Nested Stochastic Block Model (nSBM) as well as the study of the spectral space of the magnetic Laplacian can help us identify the classes of features and unravel non-trivial relationships. As a case study, we analyzed a socioeconomic survey conducted with students in Brazil: the PeNSE survey. The spectral embedding of the columns suggested that questions related to physical activities form a separate group. The application of the nSBM approach not only corroborated with that but allowed complementary findings about the modular structure: some groups of questions showed a high adherence with the divisions qualitatively defined by the designers of the survey. As opposed to the structure obtained by the spectrum, questions from the class Safety were partly grouped by our method in the class Drugs. Surprisingly, by inspecting these questions, we observed that they were related to both these topics, suggesting an alternative interpretation of these questions. These results show how our method can provide guidance for tabular data analysis as well as the design of future surveys.
AI Key Findings
Get AI-generated insights about this paper's methodology, results, significance, and more — seven facets brought into focus.
Impact
Paper Details
Authors
PDF Preview
Key Terms
Citation Network
Current paper (gray), citations (green), references (blue)
Display is limited for performance on very large graphs.
Discussion 0