Publication
Metrics
AI Quick Summary
This paper investigates the size of AGN-driven outflows in 23 luminous type 2 AGNs, finding that the outflow size correlates with AGN luminosity with a slope of 0.28±0.03. It highlights the discrepancy between kinematically-measured outflow sizes and photoionization sizes, emphasizing the need for accurate measurements to avoid uncertainties in mass outflow rates and energy output rates.
Paper Preview
Abstract
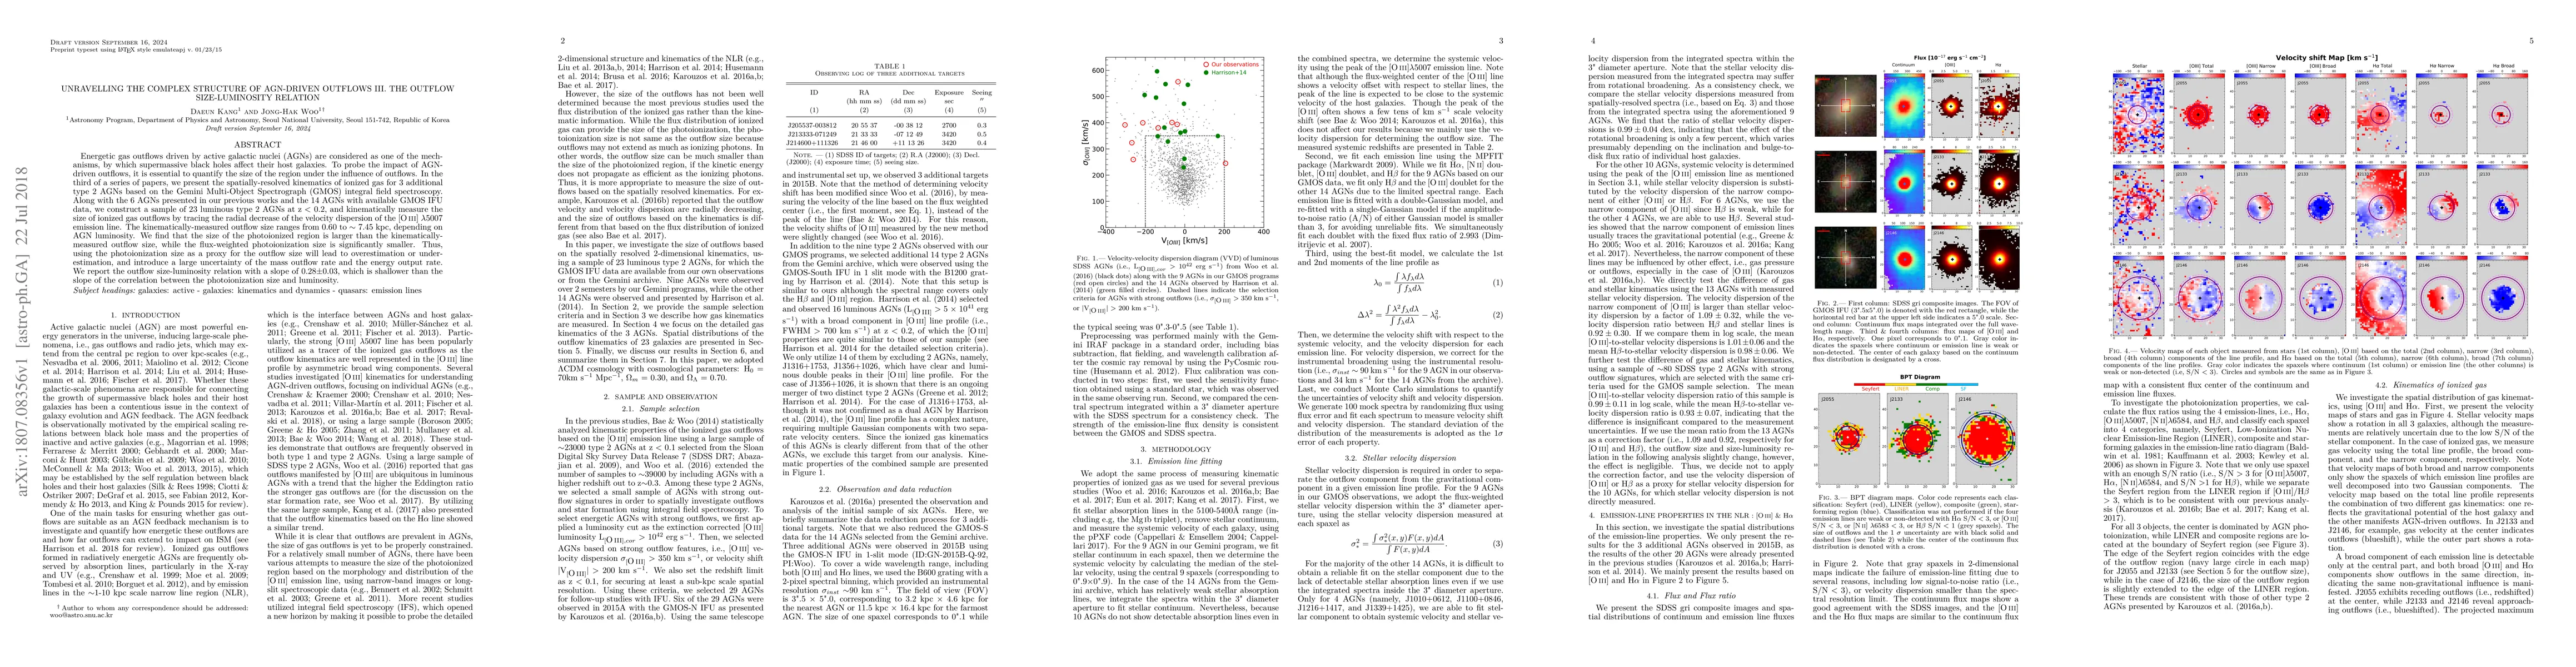
Energetic gas outflows driven by active galactic nuclei (AGNs) are considered as one of the mechanisms, by which supermassive black holes affect their host galaxies. To probe the impact of AGN-driven outflows, it is essential to quantify the size of the region under the influence of outflows. In the third of a series of papers, we present the spatially-resolved kinematics of ionized gas for 3 additional type 2 AGNs based on the Gemini Multi-Object Spectrograph (GMOS) integral field spectroscopy. Along with the 6 AGNs presented in our previous works and the 14 AGNs with available GMOS IFU data, we construct a sample of 23 luminous type 2 AGNs at z < 0.2, and kinematically measure the size of ionized gas outflows by tracing the radial decrease of the velocity dispersion of the [O iii] {\lambda}5007 emission line. The kinematically-measured outflow size ranges from 0.60 to ~7.45 kpc, depending on AGN luminosity. We find that the size of the photoionized region is larger than the kinematically-measured outflow size, while the flux-weighted photoionization size is significantly smaller. Thus, using the photoionization size as a proxy for the outflow size will lead to overestimation or underestimation, and introduce a large uncertainty of the mass outflow rate and the energy output rate. We report the outflow size-luminosity relation with a slope of 0.28{\pm}0.03, which is shallower than the slope of the correlation between the photoionization size and luminosity.
AI Key Findings
Get AI-generated insights about this paper's methodology, results, significance, and more — seven facets brought into focus.
Impact
Paper Details
PDF Preview
Key Terms
Citation Network
Current paper (gray), citations (green), references (blue)
Display is limited for performance on very large graphs.
Discussion 0