Publication
Metrics
AI Quick Summary
This paper introduces trace diagrams, a novel notation for linear algebra, aimed at advanced undergraduates. This method represents vectors as edges and matrices as markings on these edges, offering more elegant proofs compared to traditional linear algebra notation. The paper includes definitions, examples, and exercises to help students transition to this new perspective.
Paper Preview
Abstract
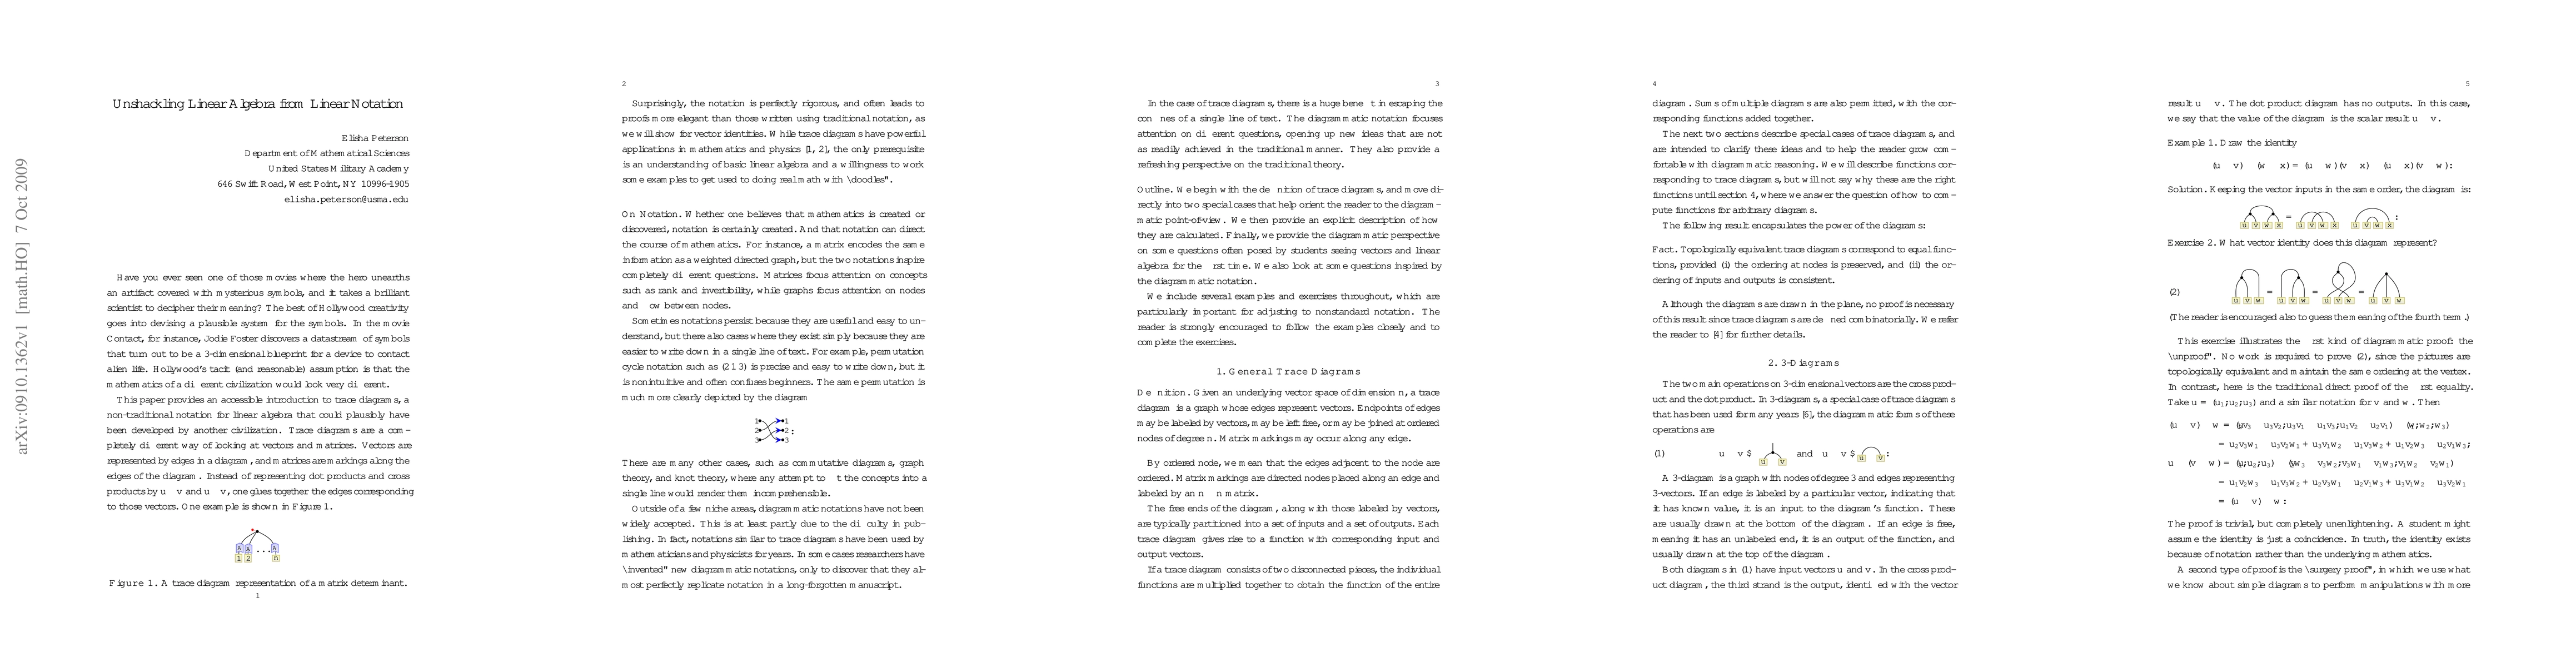
This paper provides an introduction to trace diagrams at a level suitable for advanced undergraduates. Trace diagrams are a non-traditional notation for linear algebra. Vectors are represented by edges in a diagram, and matrices by markings along the edges of the diagram. The notation is rigorous and permits proofs more elegant than those written using traditional notation. We begin with the definition of trace diagrams, and move directly into two special cases that help orient the reader to the diagrammatic point-of-view. We then provide an explicit description of how they are calculated. Finally, we provide the diagrammatic perspective on some questions often posed by students seeing vectors and linear algebra for the first time. We also look at some questions inspired by the diagrammatic notation. We include several examples and exercises throughout, which are particularly important for adjusting to nonstandard notation.
AI Key Findings
Get AI-generated insights about this paper's methodology, results, significance, and more — seven facets brought into focus.
Impact
Paper Details
PDF Preview
Key Terms
Citation Network
Current paper (gray), citations (green), references (blue)
Display is limited for performance on very large graphs.
Discussion 0