Unveiling Privacy Policy Complexity: An Exploratory Study Using Graph Mining, Machine Learning, and Natural Language Processing
Publication
Metrics
Paper Preview
Abstract
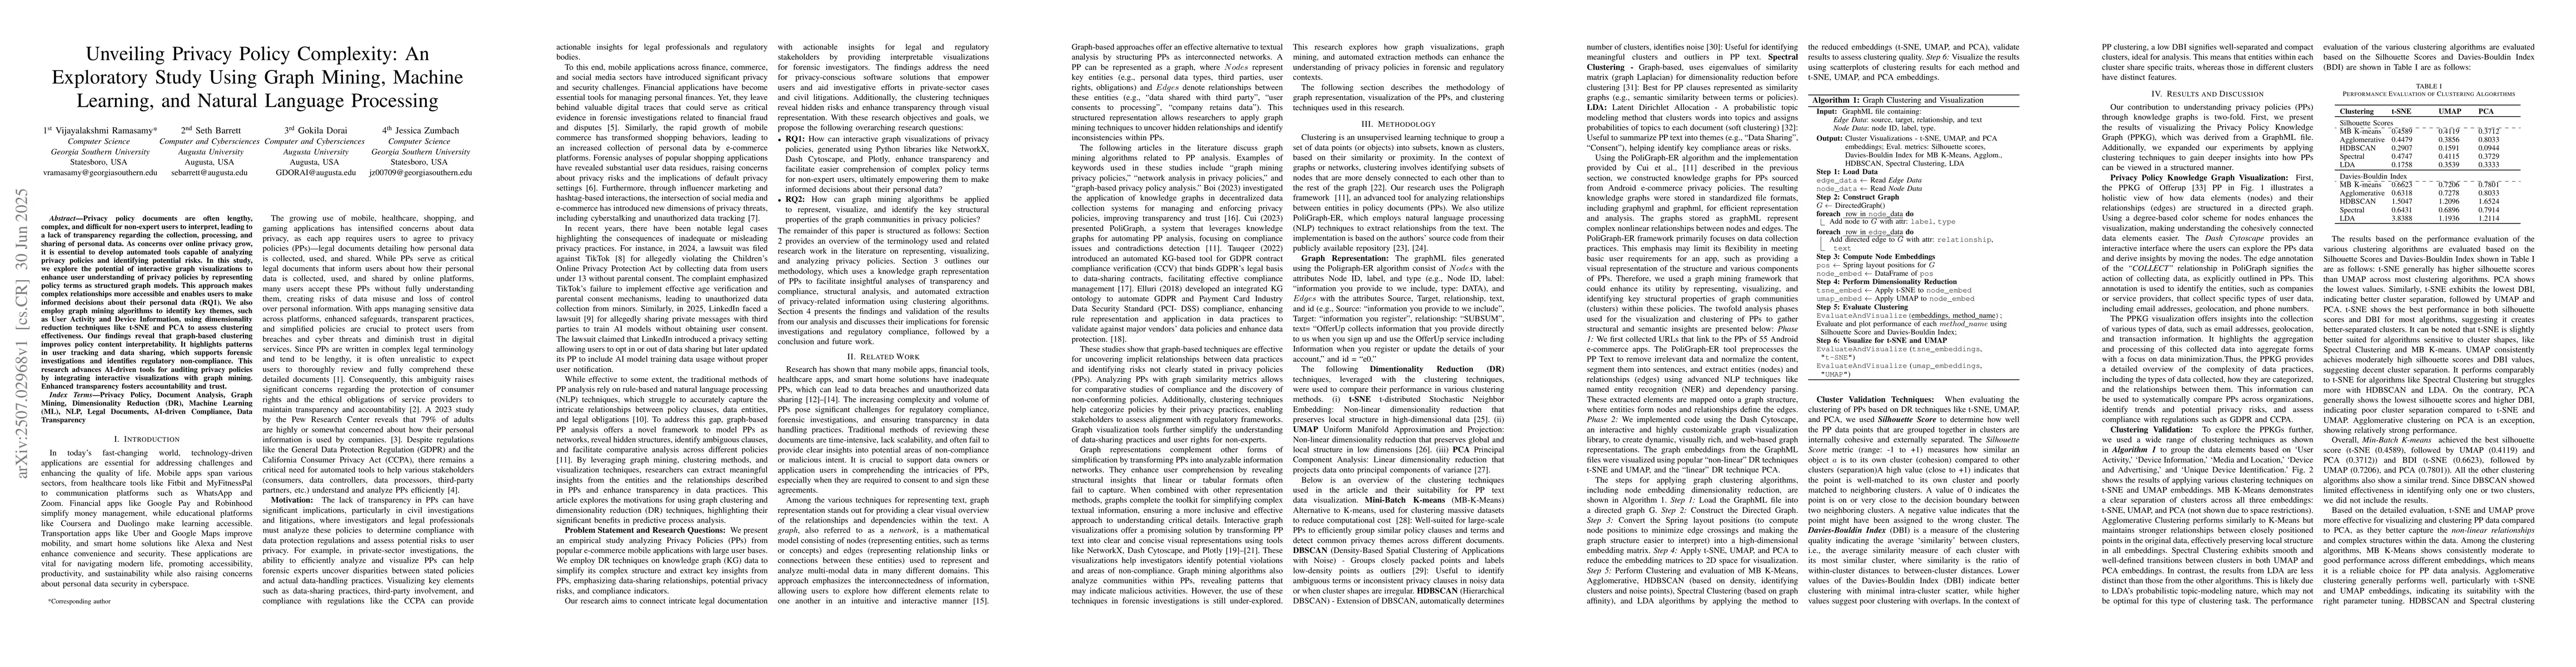
Privacy policy documents are often lengthy, complex, and difficult for non-expert users to interpret, leading to a lack of transparency regarding the collection, processing, and sharing of personal data. As concerns over online privacy grow, it is essential to develop automated tools capable of analyzing privacy policies and identifying potential risks. In this study, we explore the potential of interactive graph visualizations to enhance user understanding of privacy policies by representing policy terms as structured graph models. This approach makes complex relationships more accessible and enables users to make informed decisions about their personal data (RQ1). We also employ graph mining algorithms to identify key themes, such as User Activity and Device Information, using dimensionality reduction techniques like t-SNE and PCA to assess clustering effectiveness. Our findings reveal that graph-based clustering improves policy content interpretability. It highlights patterns in user tracking and data sharing, which supports forensic investigations and identifies regulatory non-compliance. This research advances AI-driven tools for auditing privacy policies by integrating interactive visualizations with graph mining. Enhanced transparency fosters accountability and trust.
AI Key Findings
Get AI-generated insights about this paper's methodology, results, significance, and more — seven facets brought into focus.
Impact
Paper Details
Authors
PDF Preview
Citation Network
Current paper (gray), citations (green), references (blue)
Display is limited for performance on very large graphs.
Discussion 0