Publication
Metrics
AI Quick Summary
This paper analyzes CoRoT seismic data to reveal stellar magnetic activity, finding that HD49933 exhibits modulation in oscillation mode amplitudes and frequency shifts correlating with magnetic activity. The study establishes a lower limit of ~120 days for the activity-cycle period, corroborated by Ca H and K line measurements. Similar behaviors are observed in other stars like HD181420 and HD49835.
Paper Preview
Abstract
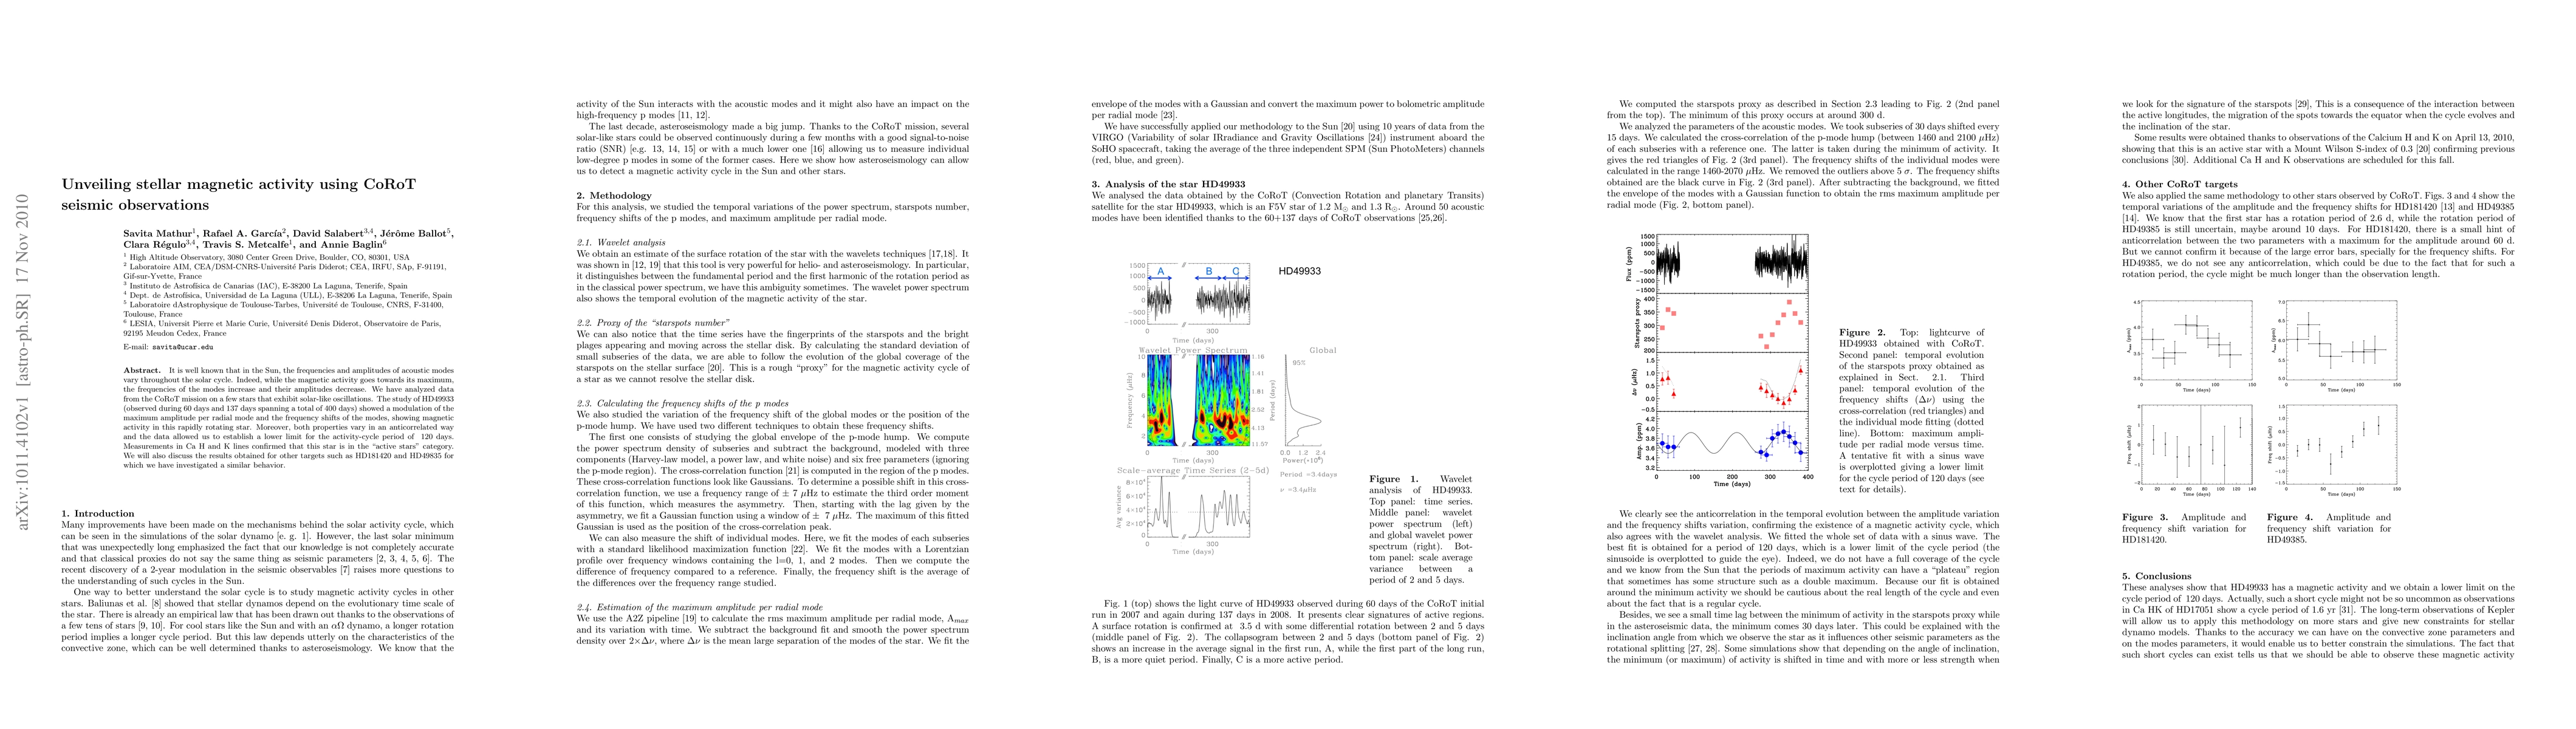
It is well known that in the Sun, the frequencies and amplitudes of acoustic modes vary throughout the solar cycle. Indeed, while the magnetic activity goes towards its maximum, the frequencies of the modes increase and their amplitudes decrease. We have analyzed data from the CoRoT mission on a few stars that exhibit solar-like oscillations. The study of HD49933 (observed during 60 days and 137 days spanning a total of 400 days) showed a modulation of the maximum amplitude per radial mode and the frequency shifts of the modes, showing magnetic activity in this rapidly rotating star. Moreover, both properties vary in an anticorrelated way and the data allowed us to establish a lower limit for the activity-cycle period of ~120 days. Measurements in Ca H and K lines confirmed that this star is in the "active stars" category. We will also discuss the results obtained for other targets such as HD181420 and HD49835 for which we have investigated a similar behavior.
AI Key Findings
Get AI-generated insights about this paper's methodology, results, significance, and more — seven facets brought into focus.
Impact
Paper Details
PDF Preview
Key Terms
Citation Network
Current paper (gray), citations (green), references (blue)
Display is limited for performance on very large graphs.
Discussion 0