Urban Dengue and Spatial Dependence: A SAR Model Incorporating Favela Data in Recife, Brazil
Publication
Metrics
Paper Preview
Abstract
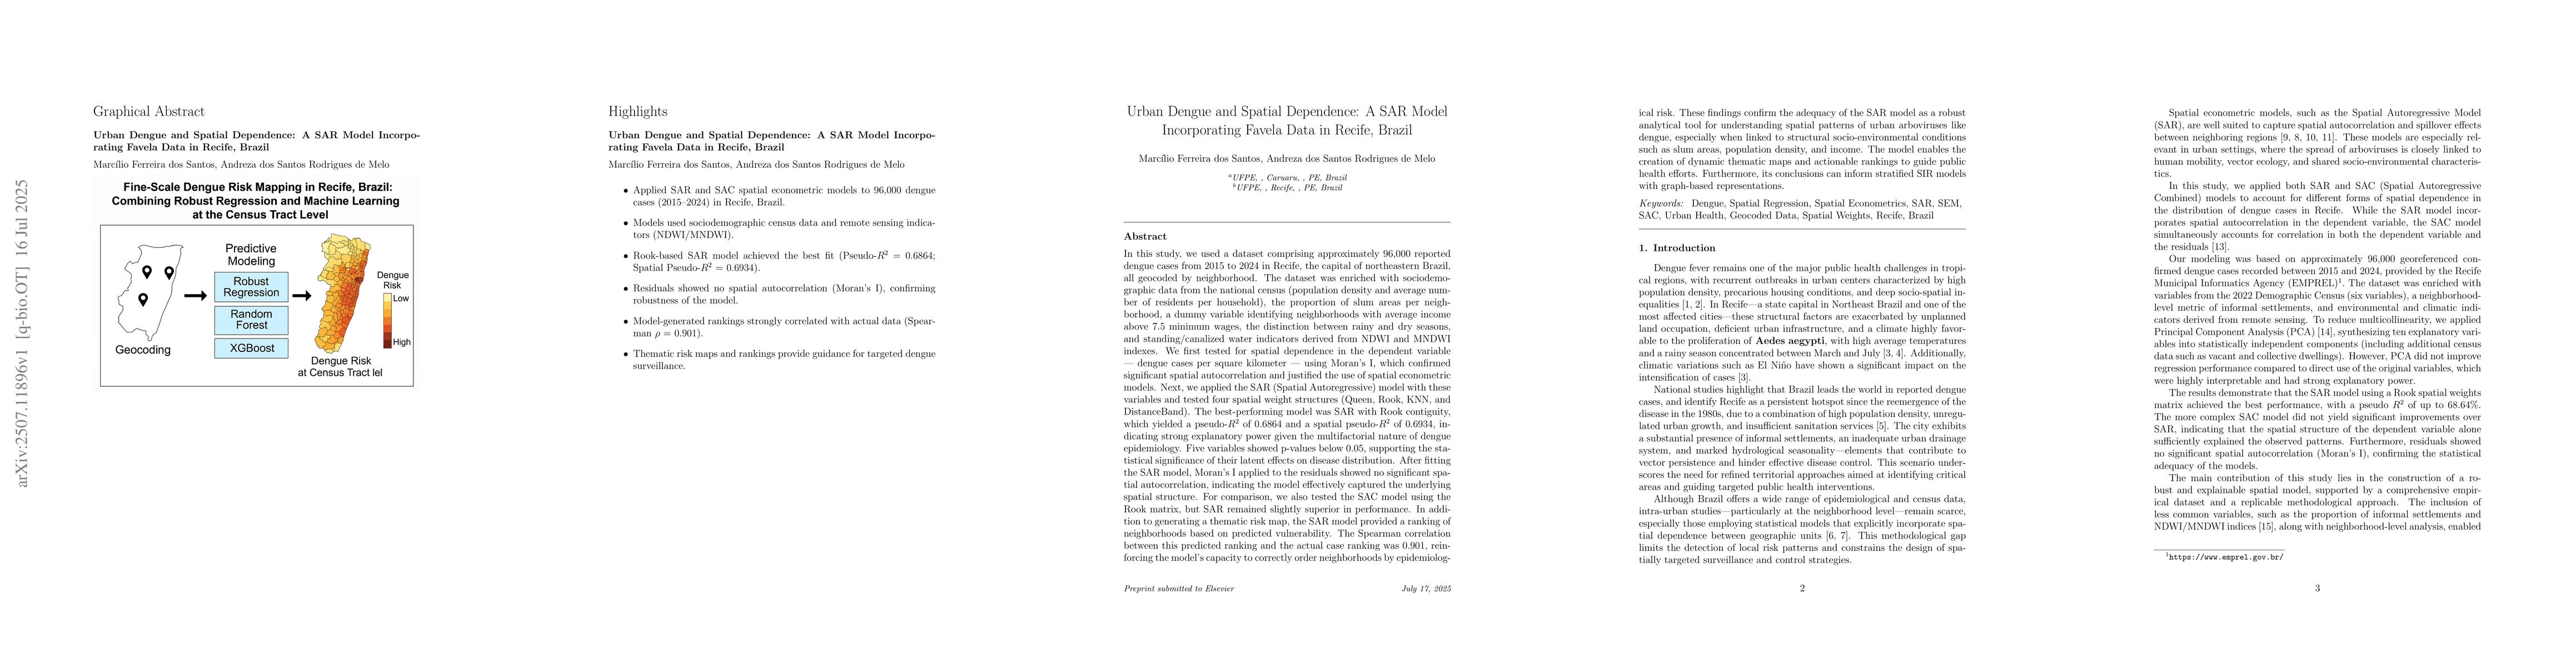
In this study, we used a dataset of approximately 96,000 reported dengue cases from 2015 to 2024 in Recife, the capital of northeastern Brazil, all geocoded by neighborhood. The dataset was enriched with sociodemographic data from the national census (population density, average residents per household), the proportion of slum areas per neighborhood, a dummy variable for high-income neighborhoods (above 7.5 minimum wages), seasonal information (rainy/dry), and water indicators derived from NDWI and MNDWI indexes. We first tested for spatial dependence in dengue cases per square kilometer using Moran's I, which confirmed significant spatial autocorrelation, justifying spatial econometric models. We then applied the SAR (Spatial Autoregressive) model with the listed variables and tested four spatial weight structures (Queen, Rook, KNN, Distance Band). The best-performing model was SAR with Rook contiguity, yielding a pseudo-R-squared of 0.6864 and a spatial pseudo-R-squared of 0.6934. Five variables showed p-values below 0.05. Moran's I applied to the residuals showed no significant spatial autocorrelation, suggesting the model effectively captured spatial structure. The SAC model (also with Rook) was tested but SAR remained slightly superior. In addition to generating a thematic risk map, the SAR model ranked neighborhoods by predicted vulnerability. The Spearman correlation between predicted and observed rankings was 0.901. These findings support SAR as a robust tool for understanding urban dengue patterns and for informing graph-based SIR models.
AI Key Findings
Get AI-generated insights about this paper's methodology, results, significance, and more — seven facets brought into focus.
Impact
Paper Details
Authors
PDF Preview
Citation Network
Current paper (gray), citations (green), references (blue)
Display is limited for performance on very large graphs.
Discussion 0