Publication
Metrics
AI Quick Summary
This paper analyzes urban vehicular traffic in Tigre, Argentina, using a hybrid stochastic model combining linear and nonlinear approaches from Part I. The study confirms that traffic dynamics can be modeled as an $n$-step stochastic process and suggests optimizations to reduce idle times at traffic lights.
Paper Preview
Abstract
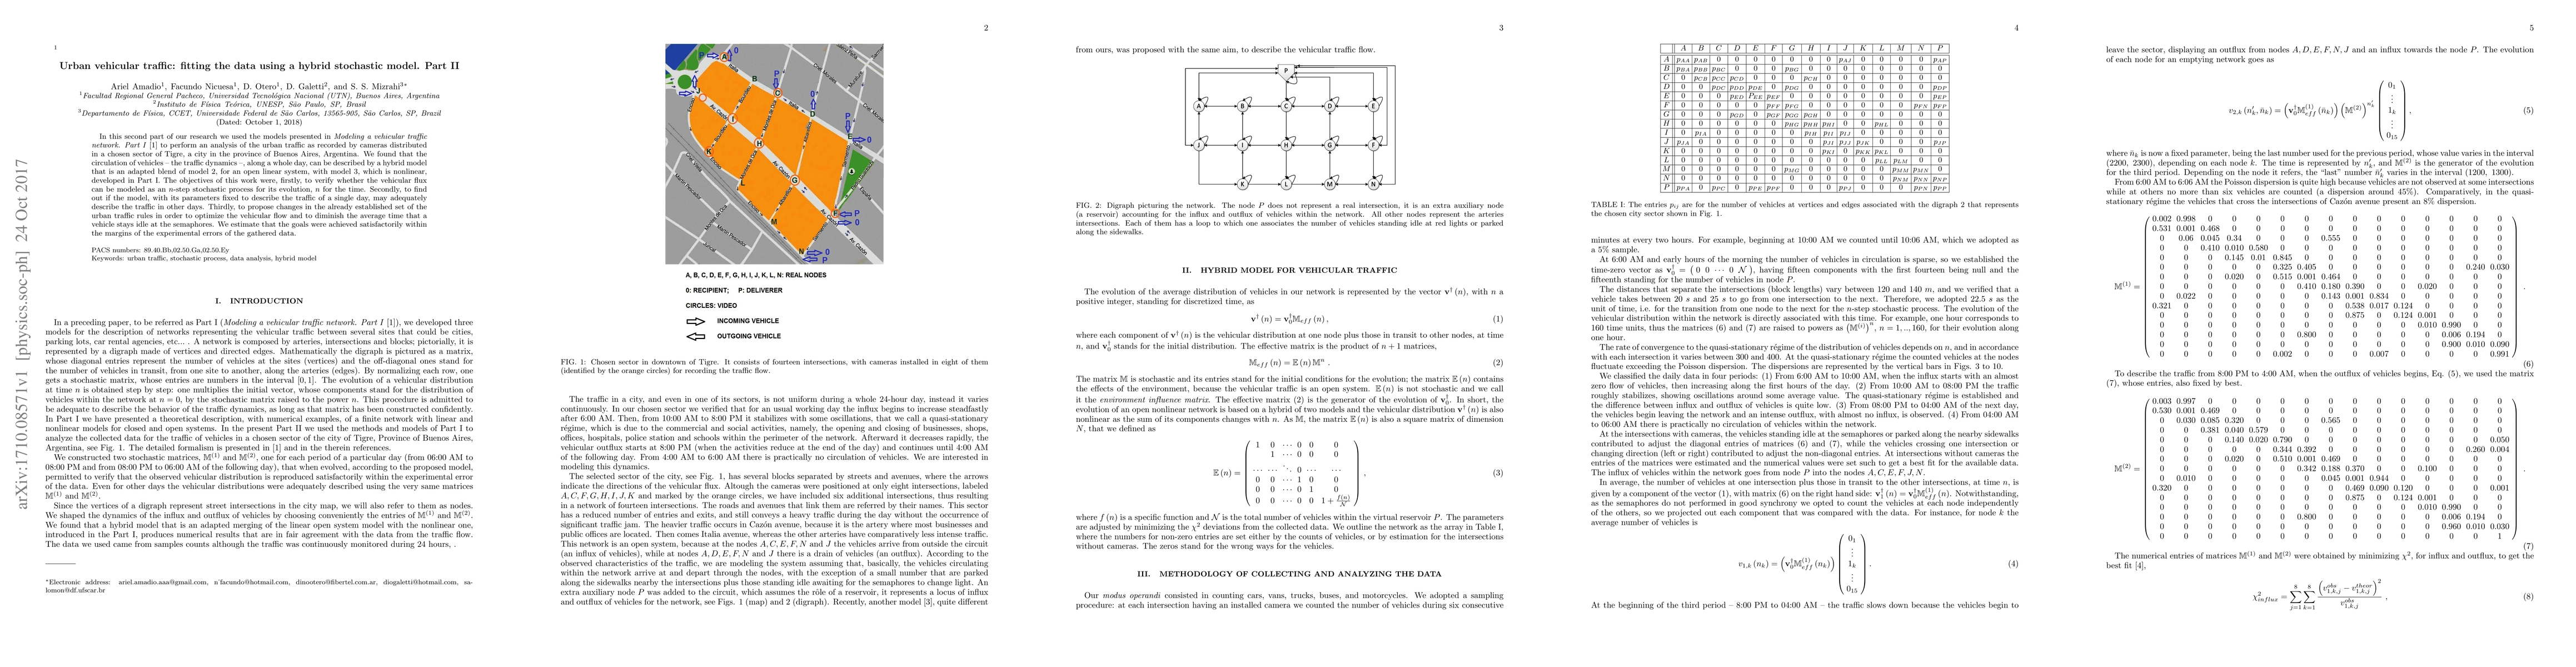
In this second part of our research we used the models presented in \emph{Modeling a vehicular traffic network. Part I} \cite{ogm1} to perform an analysis of the urban traffic as recorded by cameras distributed in a chosen sector of Tigre, a city in the province of Buenos Aires, Argentina. We found that the circulation of vehicles -- the traffic dynamics --, along a whole day, can be described by a hybrid model that is an adapted blend of model 2, for an open linear system, with model 3, which is nonlinear, developed in Part I. The objectives of this work were, firstly, to verify whether the vehicular flux can be modeled as an $n$-step stochastic process for its evolution, $n$ for the time. Secondly, to find out if the model, with its parameters fixed to describe the traffic of a single day, may adequately describe the traffic in other days. Thirdly, to propose changes in the already established set of the urban traffic rules in order to optimize the vehicular flow and to diminish the average time that a vehicle stays idle at the semaphores. We estimate that the goals were achieved satisfactorily within the margins of the experimental errors of the gathered data.
AI Key Findings
Get AI-generated insights about this paper's methodology, results, significance, and more — seven facets brought into focus.
Impact
Paper Details
PDF Preview
Key Terms
Citation Network
Current paper (gray), citations (green), references (blue)
Display is limited for performance on very large graphs.
Discussion 0