Use of NoSQL database and visualization techniques to analyze massive scholarly article data from journals
Publication
Metrics
Paper Preview
Abstract
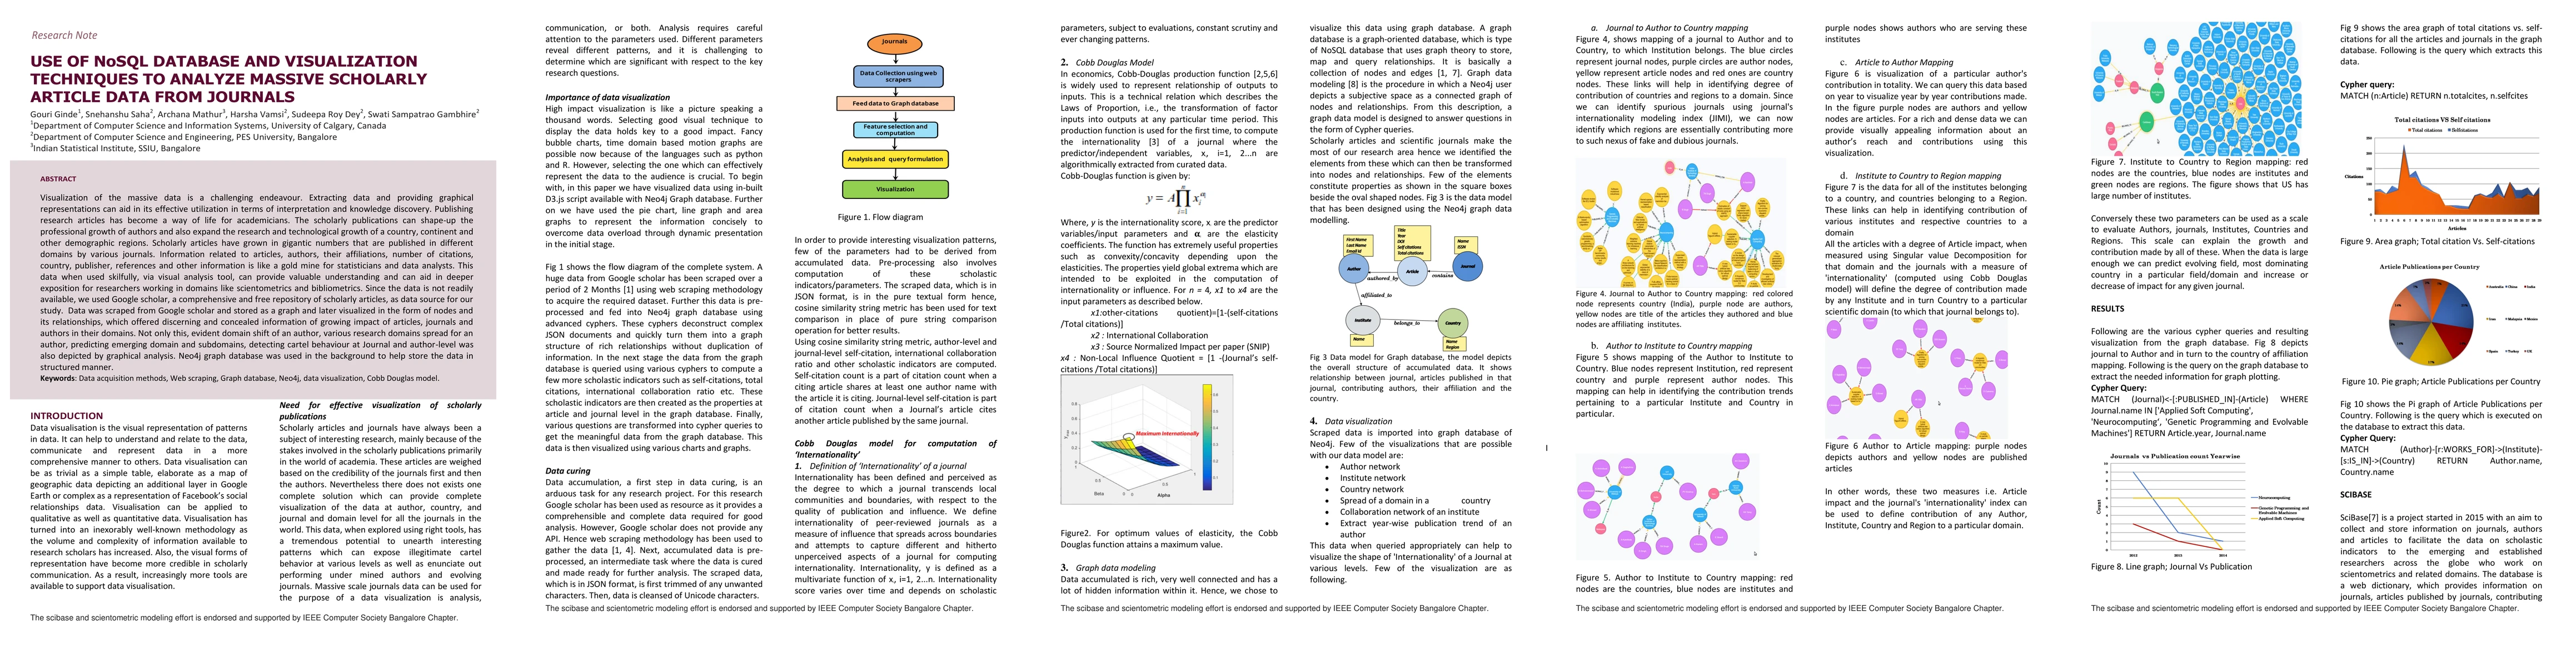
Visualization of the massive data is a challenging endeavor. Extracting data and providing graphical representations can aid in its effective utilization in terms of interpretation and knowledge discovery. Publishing research articles has become a way of life for academicians. The scholarly publications can shape-up the professional growth of authors and also expand the research and technological growth of a country, continent and other demographic regions. Scholarly articles have grown in gigantic numbers that are published in different domains by various journals. Information related to articles, authors, their affiliations, number of citations, country, publisher, references and other information is like a gold mine for statisticians and data analysts. This data when used skillfully, via visual analysis tool, can provide valuable understanding and can aid in deeper exposition for researchers working in domains like scientometrics and bibliometrics. Since the data is not readily available, we used Google scholar, a comprehensive and free repository of scholarly articles, as data source for our study. Data was scraped from Google scholar and stored as a graph and later visualized in the form of nodes and its relationships, which offered discerning and concealed information of growing impact of articles, journals and authors in their domains. Not only this, evident domain shift of an author, various research domains spread for an author, predicting emerging domain and subdomains, detecting cartel behavior at Journal and author-level was also depicted by graphical analysis. Neo4j graph database was used in the background to help store the data in structured manner.
AI Key Findings
Get AI-generated insights about this paper's methodology, results, significance, and more — seven facets brought into focus.
Impact
Paper Details
PDF Preview
Key Terms
Citation Network
Current paper (gray), citations (green), references (blue)
Display is limited for performance on very large graphs.
Discussion 0