Summary
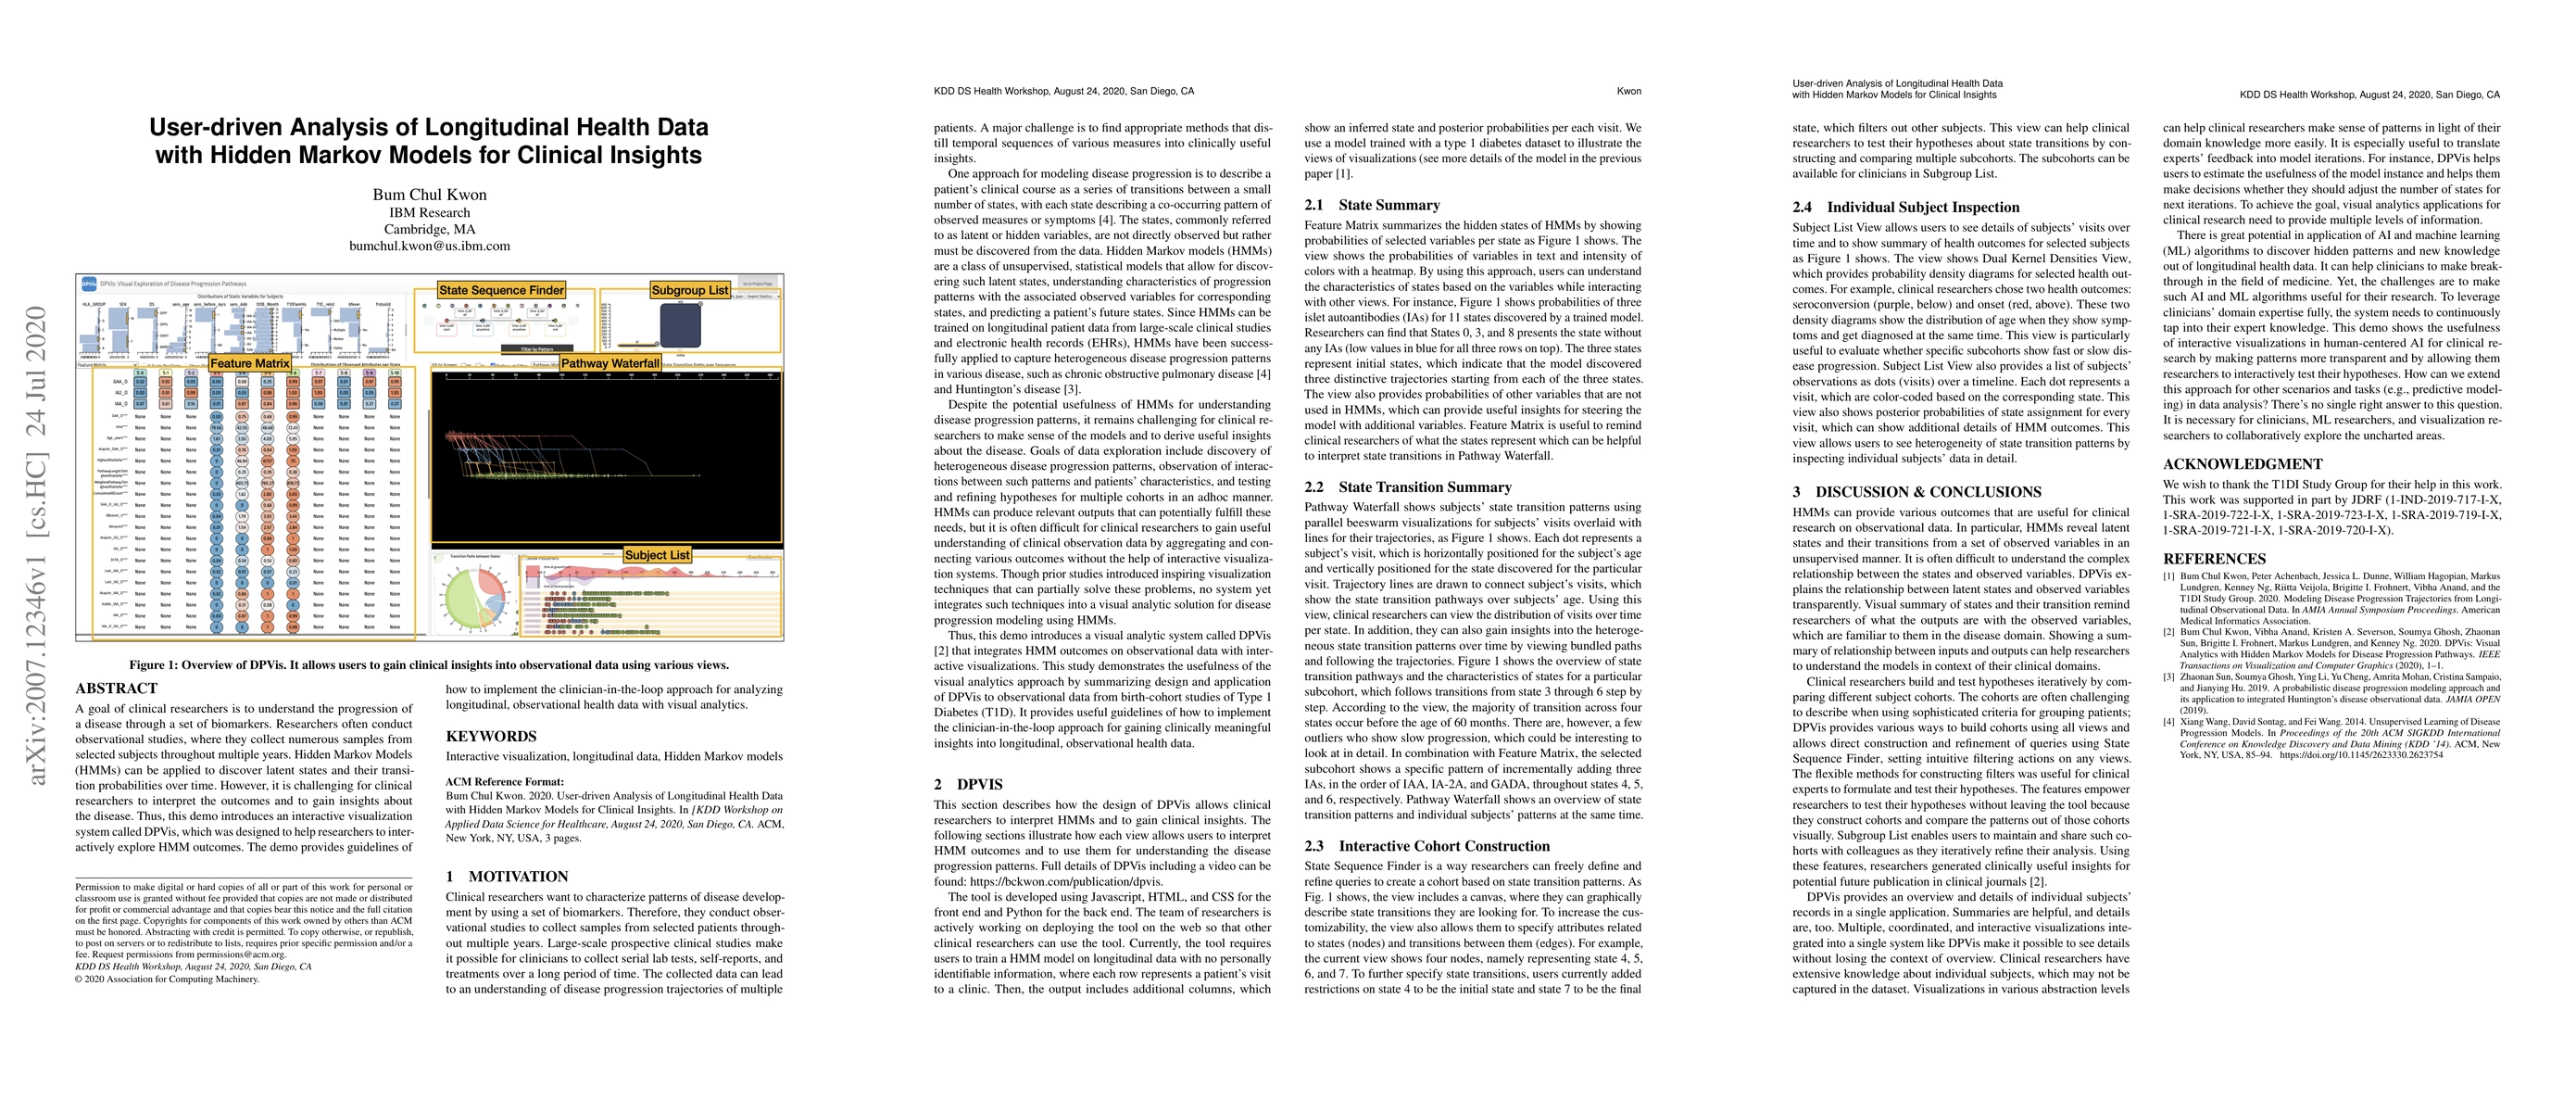
A goal of clinical researchers is to understand the progression of a disease through a set of biomarkers. Researchers often conduct observational studies, where they collect numerous samples from selected subjects throughout multiple years. Hidden Markov Models (HMMs) can be applied to discover latent states and their transition probabilities over time. However, it is challenging for clinical researchers to interpret the outcomes and to gain insights about the disease. Thus, this demo introduces an interactive visualization system called DPVis, which was designed to help researchers to interactively explore HMM outcomes. The demo provides guidelines of how to implement the clinician-in-the-loop approach for analyzing longitudinal, observational health data with visual analytics.
AI Key Findings
Get AI-generated insights about this paper's methodology, results, and significance.
Paper Details
PDF Preview
Key Terms
Citation Network
Current paper (gray), citations (green), references (blue)
Display is limited for performance on very large graphs.
Similar Papers
Found 4 papersData-Driven Quickest Change Detection in (Hidden) Markov Models
Qi Zhang, Shaofeng Zou, Zhongchang Sun et al.
No citations found for this paper.
Comments (0)