Using 3D Printing to Visualize Social Media Big Data
Publication
Metrics
Paper Preview
Abstract
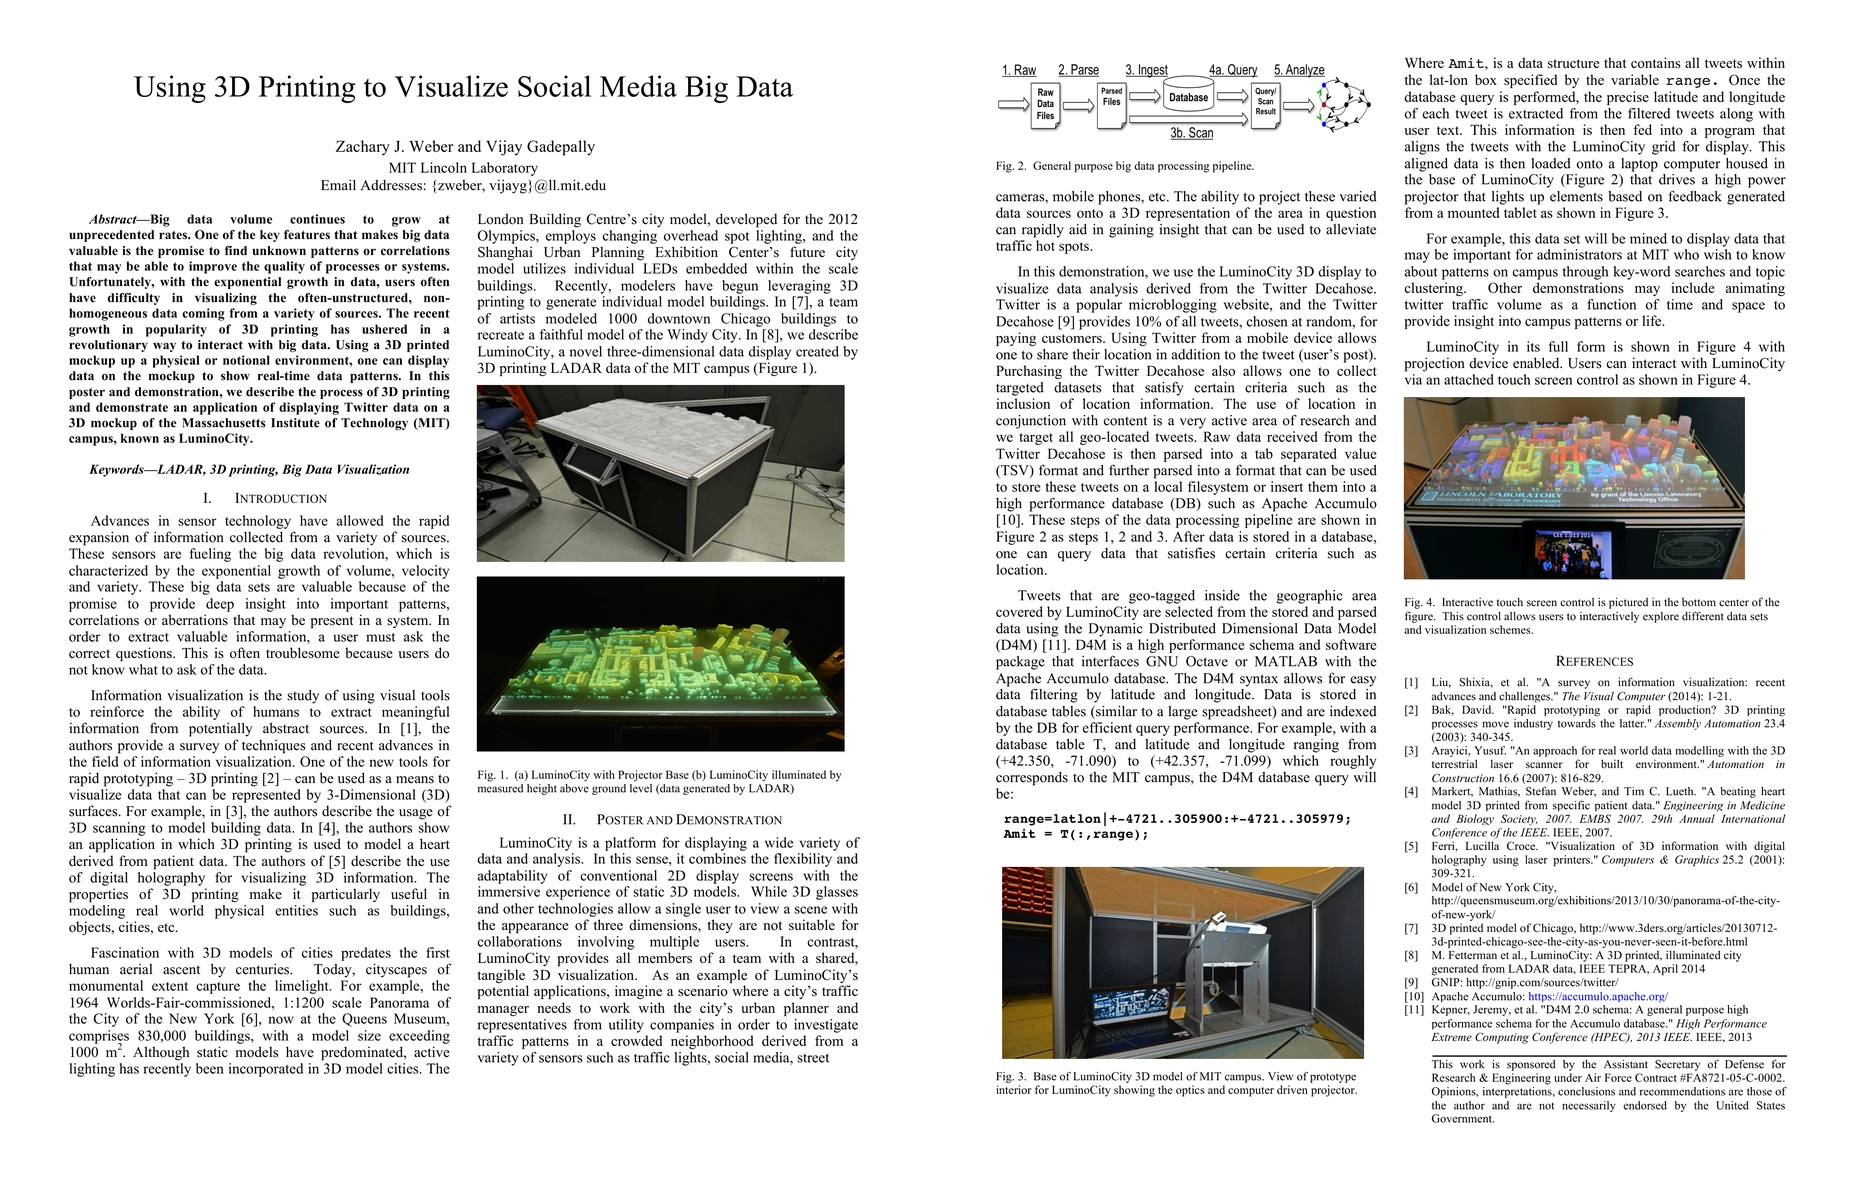
Big data volume continues to grow at unprecedented rates. One of the key features that makes big data valuable is the promise to find unknown patterns or correlations that may be able to improve the quality of processes or systems. Unfortunately, with the exponential growth in data, users often have difficulty in visualizing the often-unstructured, non-homogeneous data coming from a variety of sources. The recent growth in popularity of 3D printing has ushered in a revolutionary way to interact with big data. Using a 3D printed mockup up a physical or notional environment, one can display data on the mockup to show real-time data patterns. In this poster and demonstration, we describe the process of 3D printing and demonstrate an application of displaying Twitter data on a 3D mockup of the Massachusetts Institute of Technology (MIT) campus, known as LuminoCity.
AI Key Findings
Get AI-generated insights about this paper's methodology, results, significance, and more — seven facets brought into focus.
Impact
Paper Details
PDF Preview
Key Terms
Citation Network
Current paper (gray), citations (green), references (blue)
Display is limited for performance on very large graphs.
Discussion 0