Using a Generative Adversarial Network for CT Normalization and its Impact on Radiomic Features
Publication
Metrics
AI Quick Summary
This study explores the use of a 3D generative adversarial network (GAN) to normalize heterogeneous low-dose chest CT scans, improving image quality and reducing variability in radiomic features. The GAN outperformed a baseline CNN method, showing a 35% improvement in perceptual similarity and significantly smaller errors in radiomic feature values.
Paper Preview
Abstract
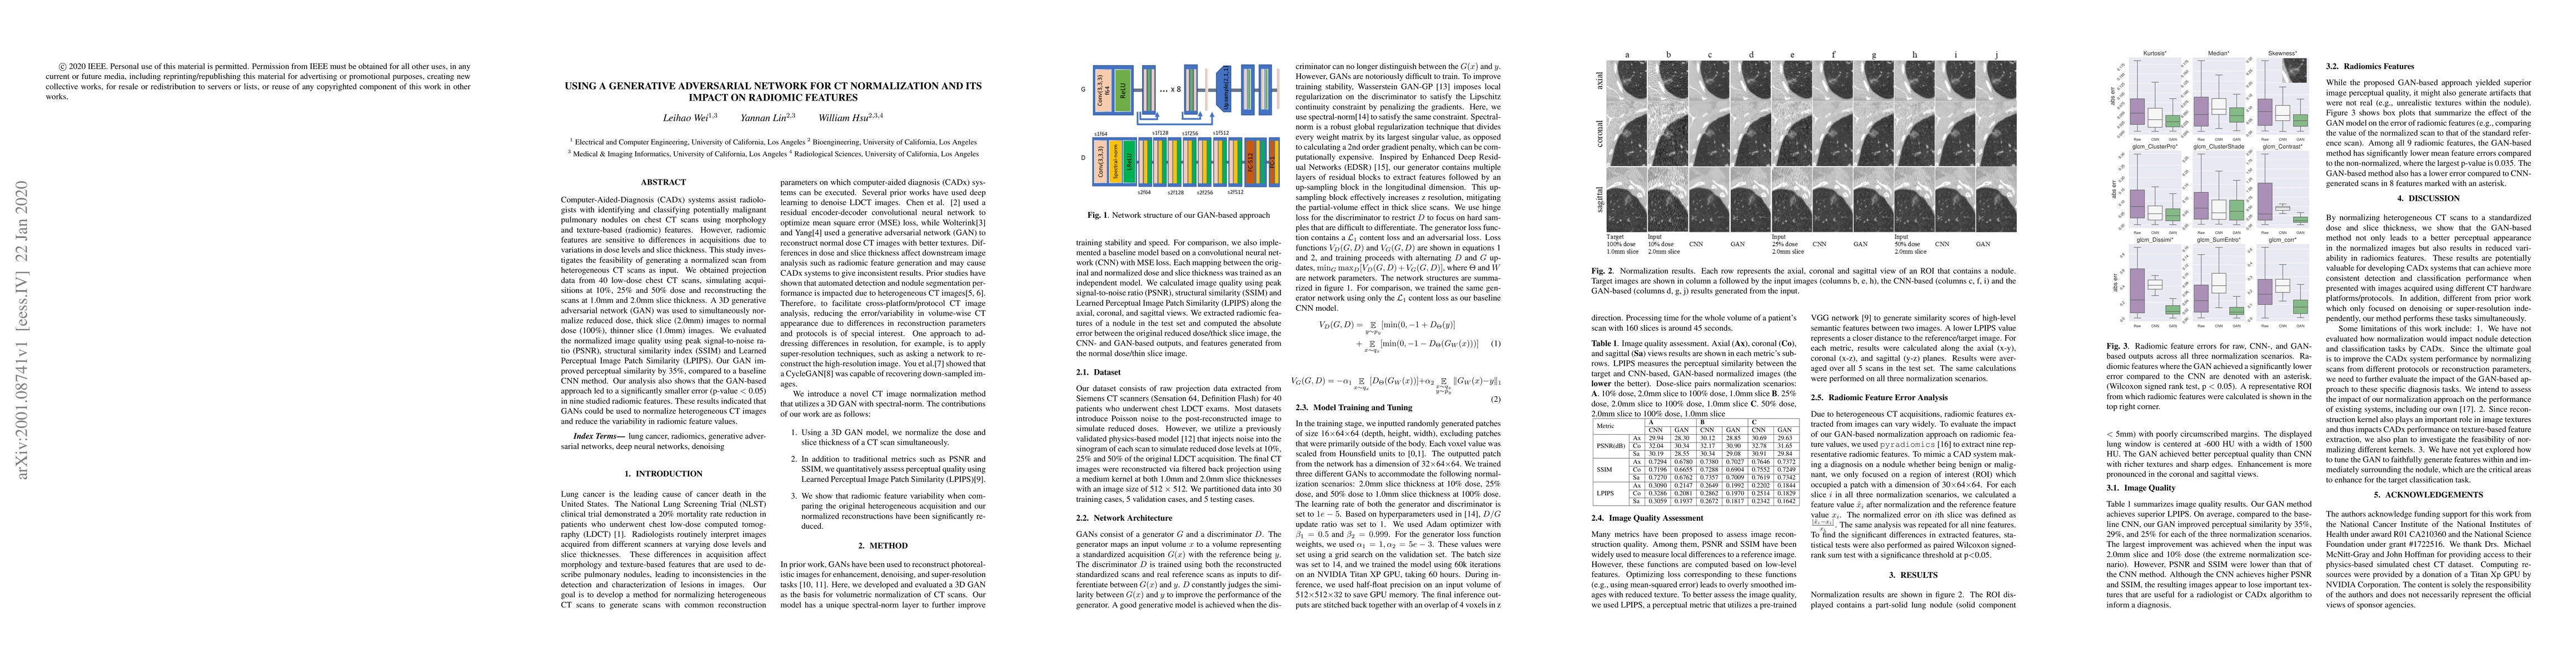
Computer-Aided-Diagnosis (CADx) systems assist radiologists with identifying and classifying potentially malignant pulmonary nodules on chest CT scans using morphology and texture-based (radiomic) features. However, radiomic features are sensitive to differences in acquisitions due to variations in dose levels and slice thickness. This study investigates the feasibility of generating a normalized scan from heterogeneous CT scans as input. We obtained projection data from 40 low-dose chest CT scans, simulating acquisitions at 10%, 25% and 50% dose and reconstructing the scans at 1.0mm and 2.0mm slice thickness. A 3D generative adversarial network (GAN) was used to simultaneously normalize reduced dose, thick slice (2.0mm) images to normal dose (100%), thinner slice (1.0mm) images. We evaluated the normalized image quality using peak signal-to-noise ratio (PSNR), structural similarity index (SSIM) and Learned Perceptual Image Patch Similarity (LPIPS). Our GAN improved perceptual similarity by 35%, compared to a baseline CNN method. Our analysis also shows that the GAN-based approach led to a significantly smaller error (p-value < 0.05) in nine studied radiomic features. These results indicated that GANs could be used to normalize heterogeneous CT images and reduce the variability in radiomic feature values.
AI Key Findings
Get AI-generated insights about this paper's methodology, results, significance, and more — seven facets brought into focus.
Impact
Paper Details
Authors
PDF Preview
Key Terms
Citation Network
Current paper (gray), citations (green), references (blue)
Display is limited for performance on very large graphs.
Discussion 0