Publication
Metrics
AI Quick Summary
This paper investigates the [CII] 158 micron emission line as a star-formation rate indicator, utilizing data from the KINGFISH and BtP programs to calibrate its effectiveness. The study finds that [CII] emission from the neutral ISM phase is a more reliable star-formation rate indicator than that from the ionized phase, as it does not exhibit a deficit in relation to infrared luminosity.
Paper Preview
Abstract
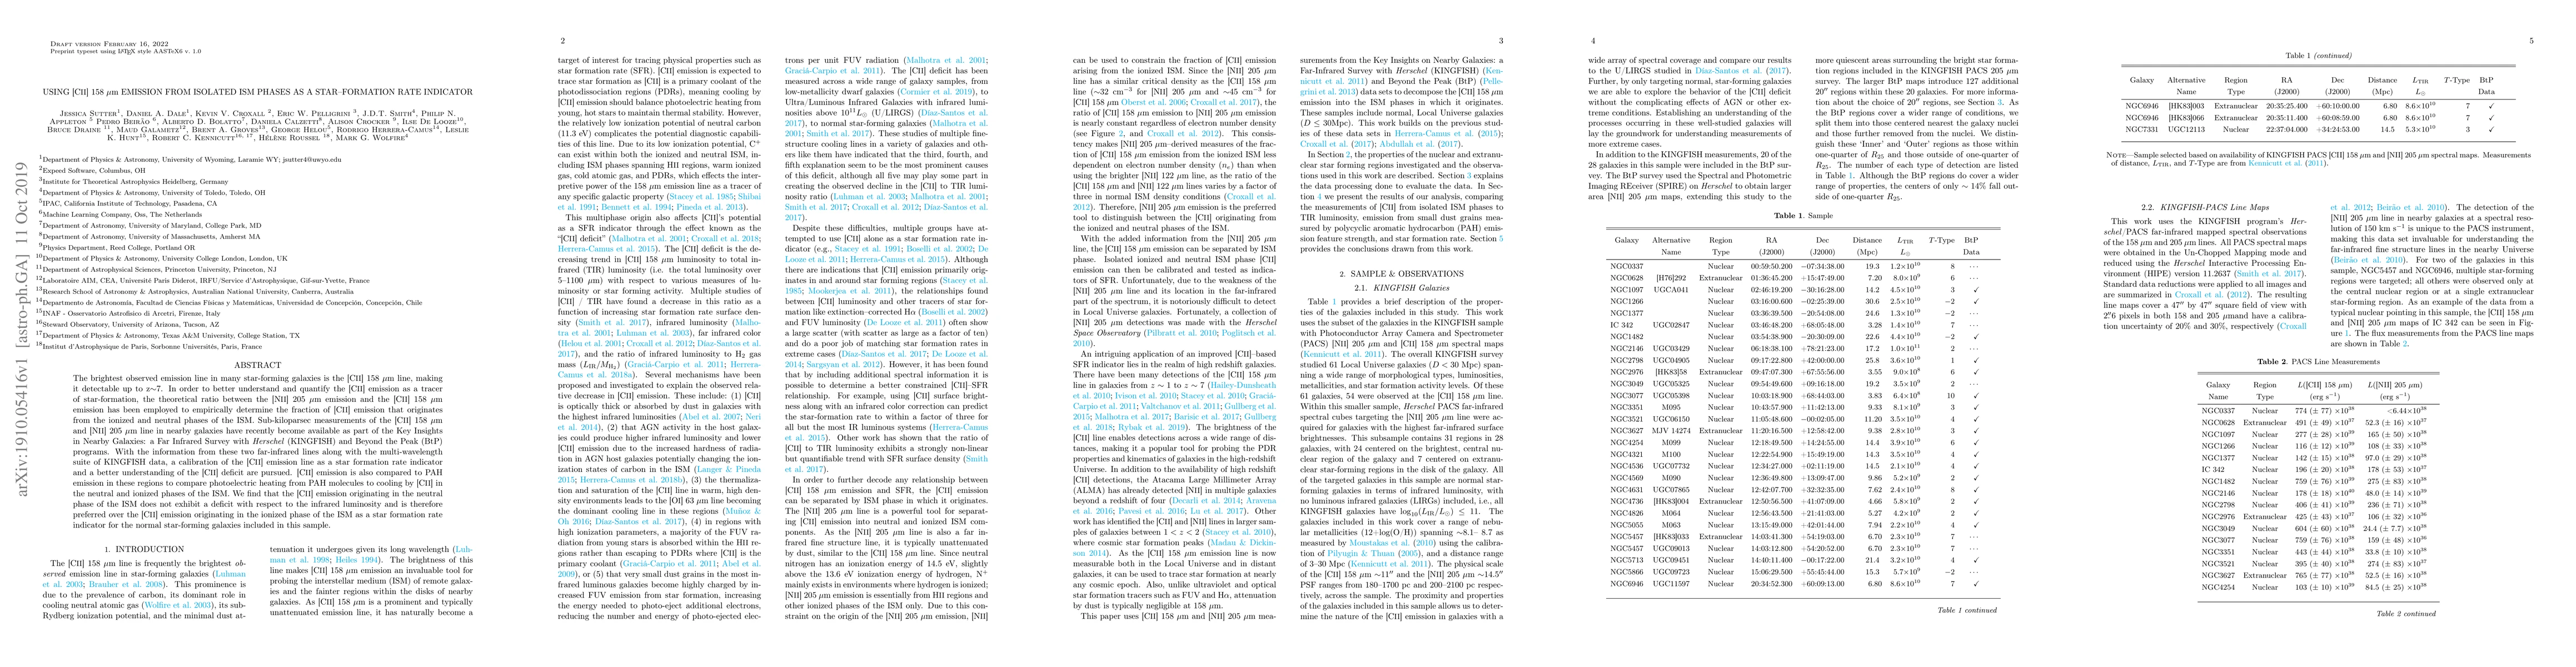
The brightest observed emission line in many star-forming galaxies is the [CII] 158 micron line, making it detectable up to z~7. In order to better understand and quantify the [CII] emission as a tracer of star-formation, the theoretical ratio between the [NII] 205 micron emission and the [CII] 158 micron emission has been employed to empirically determine the fraction of [CII] emission that originates from the ionized and neutral phases of the ISM. Sub-kiloparsec measurements of the [CII] 158 micron and [NII] 205 micron line in nearby galaxies have recently become available as part of the Key Insights in Nearby Galaxies: a Far Infrared Survey with Herschel (KINGFISH) and Beyond the Peak (BtP) programs. With the information from these two far-infrared lines along with the multi-wavelength suite of KINGFISH data, a calibration of the [CII] emission line as a star formation rate indicator and a better understanding of the [CII] deficit are pursued. [CII] emission is also compared to PAH emission in these regions to compare photoelectric heating from PAH molecules to cooling by [CII] in the neutral and ionized phases of the ISM. We find that the [CII] emission originating in the neutral phase of the ISM does not exhibit a deficit with respect to the infrared luminosity and is therefore preferred over the [CII] emission originating in the ionized phase of the ISM as a star formation rate indicator for the normal star-forming galaxies included in this sample.
AI Key Findings
Get AI-generated insights about this paper's methodology, results, significance, and more — seven facets brought into focus.
Impact
Paper Details
Authors
PDF Preview
Key Terms
Citation Network
Current paper (gray), citations (green), references (blue)
Display is limited for performance on very large graphs.
Discussion 0