ArxivLens

Publication

Published: Mar 31, 2025
Updated: Apr 11, 2025
Categories: stat.ME

Metrics

Source: ArXiv

AI Quick Summary

A new algorithm using directed acyclic graphs determines when multiple imputation is valid for exposure-outcome associations with multiple incomplete variables, and whether subsample MI is unbiased in complex datasets.

Quick Answers

What is "Using directed acyclic graphs to determine whether multiple imputation or subsample multiple imputation estimates of an exposure-outcome association are unbiased" about?

A new algorithm using directed acyclic graphs determines when multiple imputation is valid for exposure-outcome associations with multiple incomplete variables, and whether subsample MI is unbiased in complex datasets.

What methodology did the authors use?

The research presents an algorithm using directed acyclic graphs (DAGs) to determine when multiple imputation (MI) estimates of an exposure-outcome association are unbiased, extending it to assess subsample MI. The algorithm identifies variables that are dependent on response indicators for incomplete variables, conditioned on complete variables, to decide on the validity of MI and subsample MI. More in Methodology →

What are the key results?

The algorithm successfully identifies scenarios where MI and subsample MI estimates are unbiased or biased. — In complex scenarios with multiple incomplete variables, visual identification of dependencies becomes challenging, and the algorithm provides a systematic approach. More in Key Results →

Why is this work significant?

This research provides practical guidance for applied researchers on using MI with multiple incomplete variables, addressing the lack of such guidance in existing literature. More in Significance →

What are the main limitations?

The study focuses on linear regression models and does not explore other types of models. — The algorithm's applicability to various missing data patterns and complex datasets requires further investigation. More in Limitations →

Paper Preview

Abstract

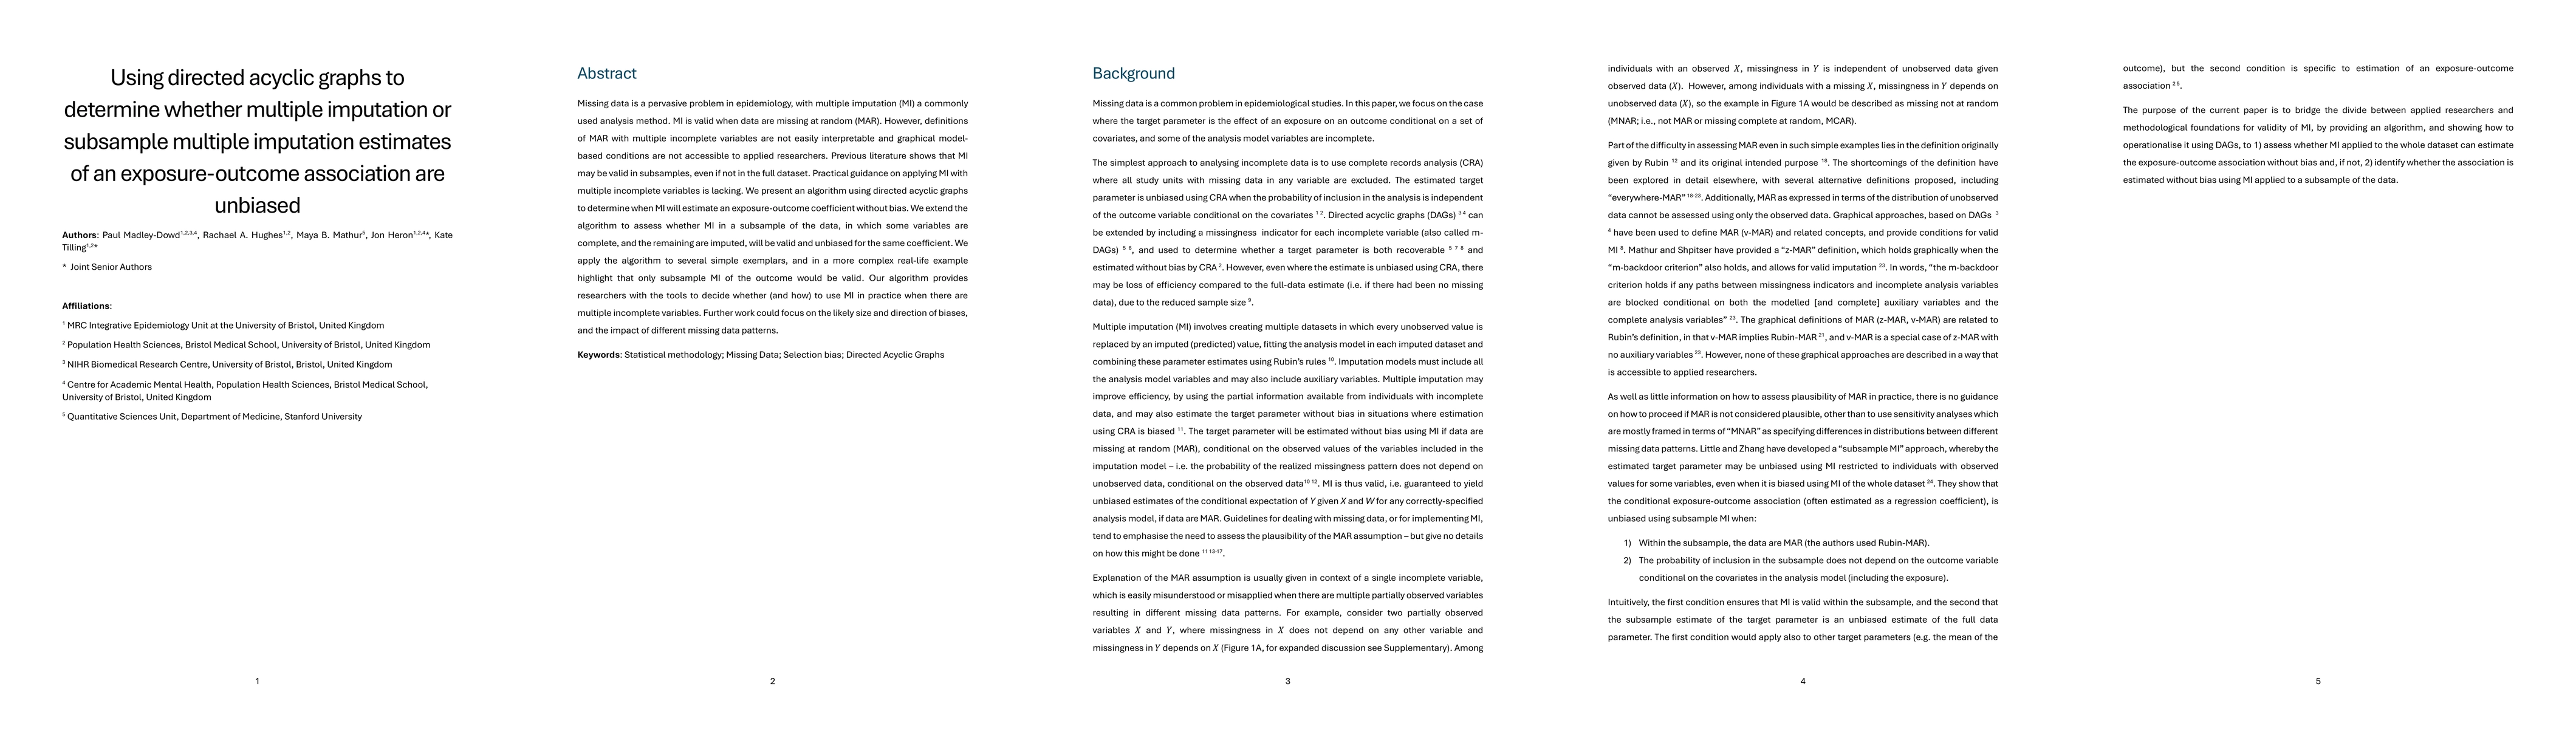
Missing data is a pervasive problem in epidemiology, with multiple imputation (MI) a commonly used analysis method. MI is valid when data are missing at random (MAR). However, definitions of MAR with multiple incomplete variables are not easily interpretable and graphical model-based conditions are not accessible to applied researchers. Previous literature shows that MI may be valid in subsamples, even if not in the full dataset. Practical guidance on applying MI with multiple incomplete variables is lacking. We present an algorithm using directed acyclic graphs to determine when MI will estimate an exposure-outcome coefficient without bias. We extend the algorithm to assess whether MI in a subsample of the data, in which some variables are complete, and the remaining are imputed, will be valid and unbiased for the same coefficient. We apply the algorithm to several simple exemplars, and in a more complex real-life example highlight that only subsample MI of the outcome would be valid. Our algorithm provides researchers with the tools to decide whether (and how) to use MI in practice when there are multiple incomplete variables. Further work could focus on the likely size and direction of biases, and the impact of different missing data patterns.
Key Findings, in focus

Seven facets of this paper, analysed and brought into focus by AI.

AI-generated · verify against source Generated Jun 10, 2025
In focus · one-line synthesis

This research provides practical guidance for applied researchers on using MI with multiple incomplete variables, addressing the lack of such guidance in existing literature.

01
MethodologyHow they did it

The research presents an algorithm using directed acyclic graphs (DAGs) to determine when multiple imputation (MI) estimates of an exposure-outcome association are unbiased, extending it to assess subsample MI. The algorithm identifies variables that are dependent on response indicators for incomplete variables, conditioned on complete variables, to decide on the validity of MI and subsample MI.

02
ResultsWhat they found
  • The algorithm successfully identifies scenarios where MI and subsample MI estimates are unbiased or biased.
  • In complex scenarios with multiple incomplete variables, visual identification of dependencies becomes challenging, and the algorithm provides a systematic approach.
  • Application to a real-life example demonstrates that only subsample MI of the outcome would be valid.
03
SignificanceWhy it matters

This research provides practical guidance for applied researchers on using MI with multiple incomplete variables, addressing the lack of such guidance in existing literature.

04
Technical ContributionsWhat's new technically

The paper introduces a novel algorithm using DAGs to determine when MI and subsample MI estimates are unbiased, offering a systematic approach for applied researchers dealing with multiple incomplete variables.

05
NoveltyWhat sets it apart

The research presents a unique application of DAGs to guide the decision on using MI in epidemiological studies with multiple incomplete variables, providing a practical solution to a long-standing challenge in the field.

06
LimitationsWhat to be cautious about
  • The study focuses on linear regression models and does not explore other types of models.
  • The algorithm's applicability to various missing data patterns and complex datasets requires further investigation.
  • The paper does not address the magnitude and direction of biases or the impact of different missing data patterns comprehensively.
07
Future WorkWhere it goes next
  • Explore the algorithm's applicability to non-linear models and more complex datasets.
  • Investigate the size and direction of biases and the impact of diverse missing data patterns.
  • Develop methods to assess the precision of MI estimates in addition to their validity.

Impact

53
References

Paper Details

Paper ID: 2503.24035
Comments: Manuscript: 23 pages, 5 Figures; Supplement: 22 pages
Categories:
stat.ME

How to Cite This Paper

Reference manager: RIS EndNote

Citation Network

Current paper (gray), citations (green), references (blue)

Display is limited for performance on very large graphs.

Current Paper
Citations
References
Click to view


Discussion 0

This website uses cookies to ensure you get the best experience. Learn more