Summary
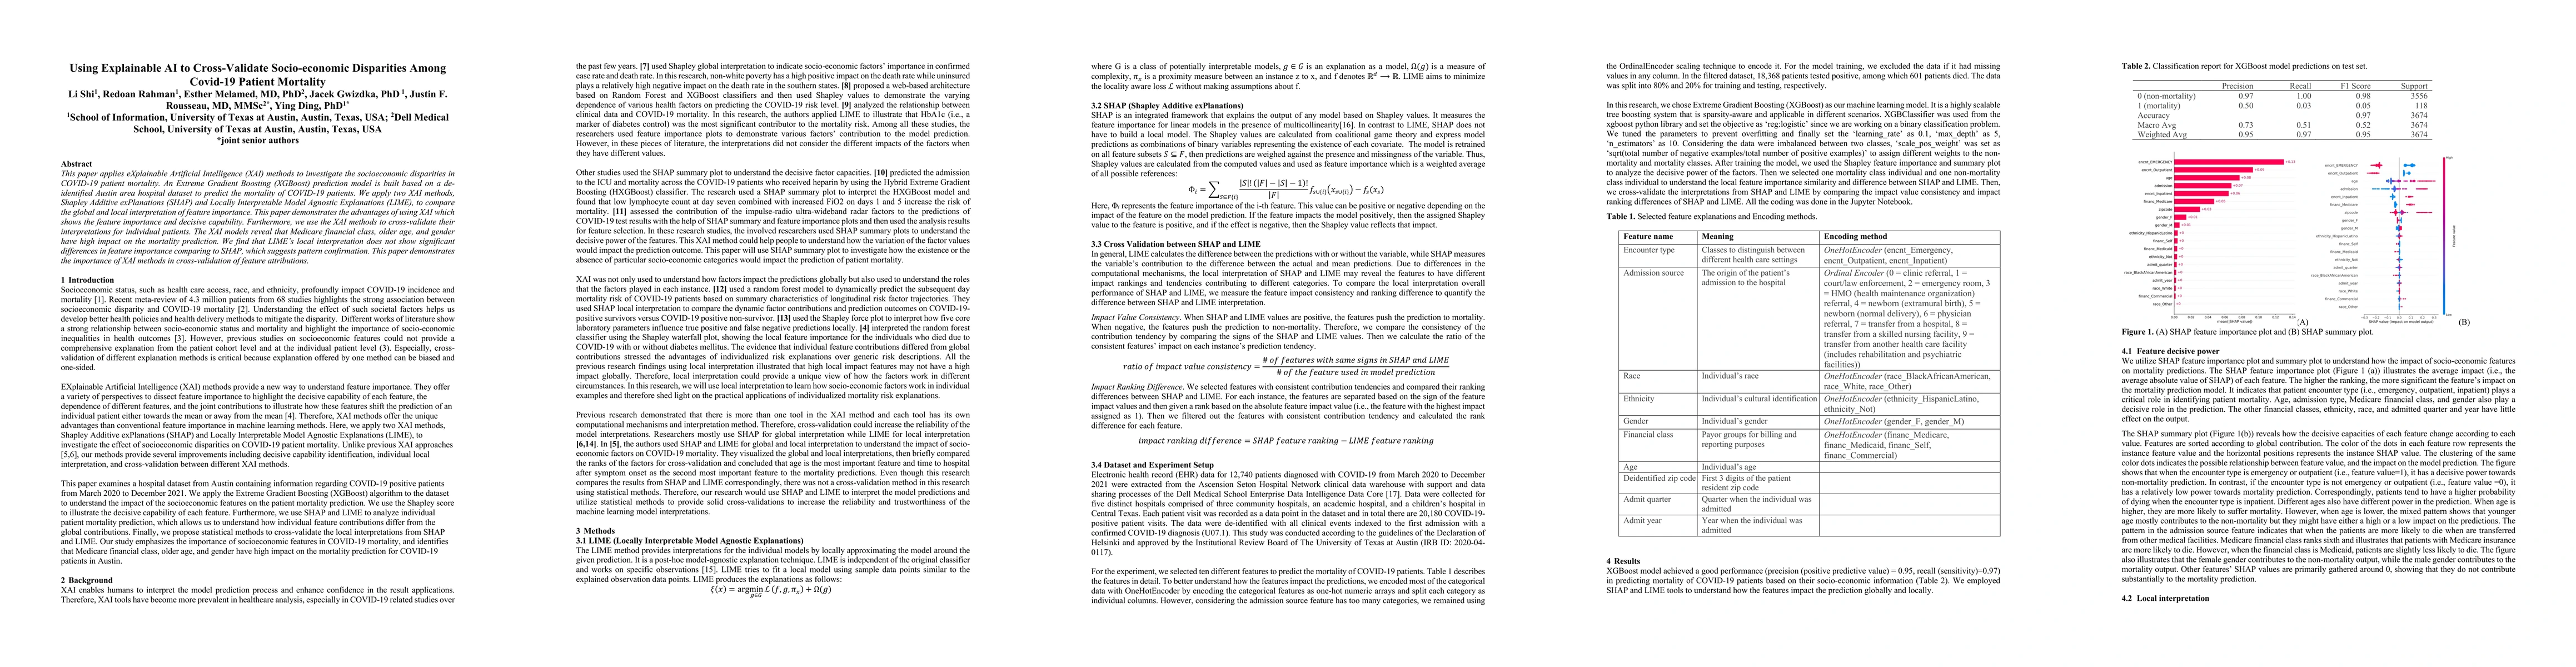
This paper applies eXplainable Artificial Intelligence (XAI) methods to investigate the socioeconomic disparities in COVID patient mortality. An Extreme Gradient Boosting (XGBoost) prediction model is built based on a de-identified Austin area hospital dataset to predict the mortality of COVID-19 patients. We apply two XAI methods, Shapley Additive exPlanations (SHAP) and Locally Interpretable Model Agnostic Explanations (LIME), to compare the global and local interpretation of feature importance. This paper demonstrates the advantages of using XAI which shows the feature importance and decisive capability. Furthermore, we use the XAI methods to cross-validate their interpretations for individual patients. The XAI models reveal that Medicare financial class, older age, and gender have high impact on the mortality prediction. We find that LIME local interpretation does not show significant differences in feature importance comparing to SHAP, which suggests pattern confirmation. This paper demonstrates the importance of XAI methods in cross-validation of feature attributions.
AI Key Findings
Get AI-generated insights about this paper's methodology, results, and significance.
Paper Details
PDF Preview
Key Terms
Citation Network
Current paper (gray), citations (green), references (blue)
Display is limited for performance on very large graphs.
Similar Papers
Found 4 papersAnalyzing Impact of Socio-Economic Factors on COVID-19 Mortality Prediction Using SHAP Value
Ying Ding, Redoan Rahman, Jooyeong Kang et al.
Using a Novel COVID-19 Calculator to Measure Positive U.S. Socio-Economic Impact of a COVID-19 Pre-Screening Solution (AI/ML)
Mert Pilanci, Les Atlas, Ayomide Owoyemi et al.
Cancer mortality projection: disparities, COVID-19, and late diagnosis impact
A. Arik, A. J. G. Cairns, G. Streftaris
| Title | Authors | Year | Actions |
|---|
Comments (0)